Business StatisticsUnit 510 min read
Sampling Methods, Estimation Techniques & Sampling Errors
Unit 5 of Business Statistics covers systematic sampling, stratified sampling, cluster sampling, and non-random sampling methods, explains sampling distributions, point estimation, interval estimation, and the Central Limit Theorem with real-world applications in eSewa surveys, Daraz customer satisfaction polls, and NE
What is Sampling?
Sampling is the process of selecting a subset of individuals from a larger population to estimate characteristics of the whole population. It is essential in business statistics because:
- Cost-effective: Collecting data from an entire population (census) is often impractical.
- Time-saving: Sampling allows quicker data collection.
- Accurate: When done correctly, sampling can provide results as accurate as a census.
Population vs. Sample
- Population: The entire group of individuals or instances about whom we hope to learn.
- Sample: A subset of the population used to represent the whole.
Types of Sampling Methods
Sampling methods can be broadly classified into two categories: Random Sampling and Non-Random Sampling.
1. Random Sampling Methods
Random sampling ensures that every member of the population has an equal chance of being selected. There are four main types:
a. Simple Random Sampling
- Every member of the population has an equal probability of being selected.
- Example: Selecting 500 customers from a list of 10,000 Daraz customers using a random number generator.
b. Systematic Sampling
- Selecting every k-th element from a list after a random start.
- Example: If a population of 10,000 is to be sampled with a sample size of 500, every 20th individual is selected (k = 10,000 / 500 = 20).
c. Stratified Sampling
- Dividing the population into homogeneous subgroups (strata) and then randomly sampling from each stratum.
- Example: Surveying students in Pokhara University by dividing them into strata based on their faculties (Management, Engineering, Humanities) and then randomly selecting students from each faculty.
d. Cluster Sampling
- Dividing the population into clusters (groups) and then randomly selecting entire clusters for sampling.
- Example: Selecting entire villages in a district to survey agricultural practices instead of individual farmers.
flowchart TD
    A["Population: All Villages in Nepal"] --> B["Cluster 1: Village A"]
    A --> C["Cluster 2: Village B"]
    A --> D["Cluster 3: Village C"]
    B --> E["Sample: Entire Village A"]
    C --> F["Not Sampled"]
    D --> G["Not Sampled"]
2. Non-Random Sampling Methods
Non-random sampling does not give every member of the population an equal chance of being selected. Common types include:
- Convenience Sampling: Selecting the most readily available members.
- Example: Surveying students in a TU classroom about their study habits.
- Judgmental/Purposive Sampling: Selecting members based on the researcher's judgment.
- Example: Selecting experienced bank managers to study customer service practices.
- Quota Sampling: Dividing the population into strata and then selecting samples based on specific quotas.
- Example: Ensuring that a survey of 1,000 people includes 500 males and 500 females.
Sampling Errors
Sampling errors occur when the sample does not perfectly represent the population. Common types include:
- Random Sampling Error: Due to the natural variation in samples.
- Systematic Error: Due to flaws in the sampling process (e.g., biased selection).
- Non-Sampling Error: Errors not related to sampling (e.g., data collection errors).
Estimation Techniques
Estimation involves using sample data to infer population parameters. There are two main types:
1. Point Estimation
- Using a single value to estimate a population parameter.
- Example: Estimating the average income of Nepali households using the mean income from a sample of 500 households.
2. Interval Estimation
- Providing a range of values (confidence interval) within which the population parameter is likely to fall.
- Example: Estimating that the average salary of Ncell employees is between Rs. 45,000 and Rs. 55,000 with 95% confidence.
Central Limit Theorem (CLT)
The CLT states that:
- The sampling distribution of the sample mean will be approximately normally distributed, regardless of the population distribution, provided the sample size is large enough (typically n ≥ 30).
- The mean of the sampling distribution will be equal to the population mean (μ).
- The standard deviation of the sampling distribution (standard error) will be equal to the population standard deviation (σ) divided by the square root of the sample size (n).
In the Real World
eSewa Surveys:
- eSewa uses stratified sampling to gather feedback from its users. The population is divided into strata based on user demographics (age, location, transaction frequency), and random samples are taken from each stratum to estimate overall customer satisfaction.
Daraz Customer Satisfaction Polls:
- Daraz employs systematic sampling to select customers for satisfaction surveys. After a random start, every 100th order is selected to ensure a representative sample of shoppers.
NEPSE Stock Index Calculation:
- The Nepal Stock Exchange (NEPSE) uses cluster sampling to calculate its index. The entire market is divided into clusters (sectors like banking, hydropower, etc.), and a representative sample of stocks from each sector is used to compute the index.
Worked Example: Sampling in Ncell Customer Retention Study
Scenario: Ncell wants to estimate the average monthly data usage of its prepaid customers in Kathmandu. The population size is 500,000 customers, and the sample size is 1,000.
Step 1: Choose Sampling Method
Ncell decides to use stratified sampling because:
- Customers vary significantly by usage patterns (low, medium, high).
- Stratifying by usage tier ensures each group is represented.
Step 2: Divide into Strata
- Low Usage: < 5GB/month (30% of population)
- Medium Usage: 5-15GB/month (50% of population)
- High Usage: >15GB/month (20% of population)
Step 3: Allocate Sample Size
- Low Usage: 300 customers (30% of 1,000)
- Medium Usage: 500 customers (50% of 1,000)
- High Usage: 200 customers (20% of 1,000)
Step 4: Randomly Select Samples
- Use a random number generator to select 300 customers from the low-usage tier, 500 from medium, and 200 from high.
Step 5: Calculate Sample Mean
Suppose the sample data usage (in GB) is as follows:
- Low Usage: Mean = 3.2 GB
- Medium Usage: Mean = 9.5 GB
- High Usage: Mean = 22.1 GB
Weighted Sample Mean:
Comparison Table: Sampling Methods
| Method | Description | Advantages | Disadvantages | Best Used When |
|---|---|---|---|---|
| Simple Random | Every member has equal chance. | Unbiased, easy to analyze. | Time-consuming, may not represent subgroups. | Small, homogeneous populations. |
| Systematic | Select every k-th member. | Simple, evenly spaced samples. | Can introduce bias if population is periodic. | Ordered populations (e.g., customer lists). |
| Stratified | Divide into strata, sample each. | Accurate for heterogeneous populations. | Complex, requires prior knowledge of strata. | Diverse populations (e.g., demographics). |
| Cluster | Divide into clusters, sample clusters. | Cost-effective for large populations. | Less precise than stratified sampling. | Geographically dispersed populations. |
| Convenience | Use readily available members. | Quick and inexpensive. | High risk of bias. | Preliminary studies. |
| Judgmental | Select based on expertise. | Targets specific groups effectively. | Subjective, may introduce bias. | Expert-driven studies. |
| Quota | Fill quotas from strata. | Ensures representation of subgroups. | Non-random, may introduce bias. | Market research with specific quotas. |
Advantages and Disadvantages of Sampling
Advantages:
- Cost-Effective: Reduces time and financial resources compared to a census.
- Feasible: Often the only practical way to collect data from large populations.
- Accurate: When done correctly, sampling can yield results as accurate as a census.
- Timely: Faster data collection allows quicker decision-making.
Disadvantages:
- Sampling Error: The sample may not perfectly represent the population.
- Non-Response Bias: Some selected members may refuse to participate.
- Complexity: Requires careful planning to avoid biases.
- Generalization Issues: Results may not apply to populations with different characteristics.
Exam Tip
- Understand Definitions: Be clear on the differences between population, sample, parameter, and statistic.
- Practice Sampling Methods: Know when to use simple random, stratified, cluster, or systematic sampling. Past exam questions often ask for examples or comparisons.
- Central Limit Theorem (CLT): Remember that the CLT applies to the sampling distribution of the sample mean, not individual observations. It requires a sufficiently large sample size (n ≥ 30).
- Sampling Errors: Distinguish between random sampling error, systematic error, and non-sampling error. Be ready to explain how each can occur.
- Worked Examples: Always show your steps clearly in numerical problems. For example:
- If asked to calculate the sample size for a given confidence level and margin of error, use the formula:
where:
- = Z-score for the desired confidence level (e.g., 1.96 for 95% confidence).
- = population standard deviation.
- = margin of error.
- For stratified sampling, always allocate sample sizes proportionally to stratum sizes unless specified otherwise.
- If asked to calculate the sample size for a given confidence level and margin of error, use the formula:
where:
- Real-World Applications: Connect sampling techniques to real-world scenarios like eSewa surveys, Daraz polls, or NEPSE index calculations. Examiners often test your ability to apply concepts to practical situations.
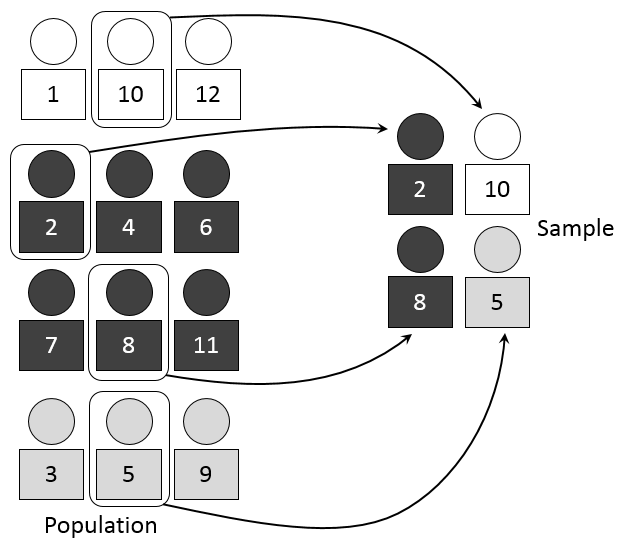 Visual representation of stratified sampling in a population (Image: Dan Kernler, CC BY-SA 4.0, via Wikimedia Commons)
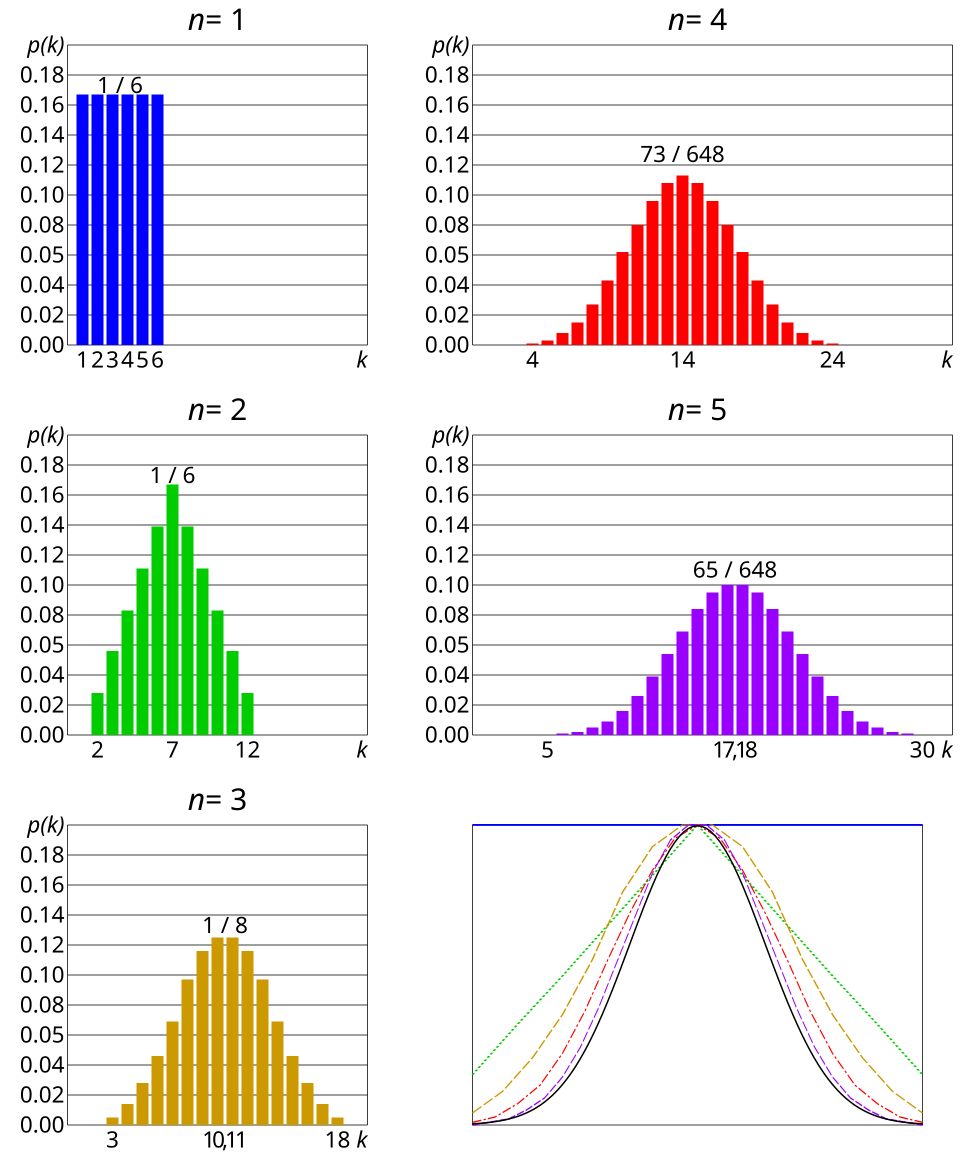 Sampling distribution of sample means illustrating the CLT (Image: Cmglee, CC BY-SA 3.0, via Wikimedia Commons)
Based on the TU BBA syllabus for Business Statistics (STT201), unit 5.
Discussion
Loading…