Financial ManagementUnit 422 min read
Capital Budgeting: NPV, IRR, PI, Payback & Real-World Investment Decisions
Unit 4 of Financial Management covers how firms evaluate long-term investment projects using discounted cash flow (DCF) methods like NPV, IRR, and PI, compares them with non-DCF techniques like payback period, and links these tools to real Nepali business decisions (e.g., hydropower projects, retail expansions) while a
TAKEAWAYS:
- NPV is king: A project with a positive NPV adds value to the firm, while negative NPV destroys it—always accept projects with NPV > 0 (and reject others) when capital is unlimited.
- IRR vs. NPV: IRR gives the break-even discount rate, but multiple IRRs or reinvestment assumptions can mislead—use NPV for consistency.
- Payback period ignores time value: It’s quick but flawed—discounted payback is better, but even that can’t capture all risks.
- Profitability Index (PI) ranks projects: PI = PV of future cash flows / Initial investment; PI > 1 means the project is profitable per rupee invested.
- Real-world trade-offs: Kathmandu’s retail expansion (like a new branch) vs. Gandaki Hydropower’s turbine upgrade—both use capital budgeting, but risk and cash flow timing differ wildly.
- Exam trap: Always reconcile NPV and IRR when answers conflict (e.g., mutually exclusive projects) and link dividend policy to leftover cash after funding profitable projects.
1. What is Capital Budgeting?
Capital budgeting is the process of planning, evaluating, and selecting long-term investment projects that align with a firm’s strategic goals. These projects typically involve:
- Fixed assets (e.g., machinery, buildings, hydropower turbines).
- Major expansions (e.g., Daraz opening a new warehouse in Pokhara).
- Replacement decisions (e.g., NTC upgrading fiber-optic cables).
- Research and development (e.g., Ncell investing in 5G infrastructure).
Why does it matter? Poor capital budgeting decisions can waste millions (e.g., failed hydropower projects) or miss growth opportunities (e.g., not expanding when demand rises). Firms like Kathmandu Manufacturing Company (KMC) must carefully analyze whether investing in new production lines (costing Rs 50M+) will yield enough future cash flows.
2. Key Capital Budgeting Techniques
A. Non-Discounted Cash Flow (DCF) Methods
These ignore the time value of money but are simple and fast.
| Method | Formula | Strengths | Weaknesses | When to Use |
|---|---|---|---|---|
| Payback Period | Years to recover initial investment | Easy to calculate, focuses on liquidity | Ignores cash flows after payback, no risk adjustment | Short-term projects, liquidity concerns |
| Discounted Payback | Years to recover PV of initial investment | Accounts for time value of money | Still ignores cash flows after payback | Better than payback, but limited use |
| Average Accounting Return (AAR) | Avg. Net Income / Avg. Book Value | Uses accounting data (familiar to managers) | Based on book value, not cash flows; ignores time value | Regulatory reporting, not investment decisions |
Example: Payback Period for a Retail Shop in Kathmandu Suppose Kathmandu Retailers Ltd. is considering opening a new store in Thapathali. The initial investment is Rs 20 million, and the expected cash flows are:
- Year 1: Rs 5M
- Year 2: Rs 7M
- Year 3: Rs 6M
- Year 4: Rs 4M
Calculation:
- Cumulative Cash Flows:
- End of Year 1: Rs 5M (Total: Rs 5M)
- End of Year 2: Rs 7M (Total: Rs 12M)
- End of Year 3: Rs 6M (Total: Rs 18M)
- The investment is recovered between Year 2 and Year 3.
- Exact Payback Period = 2 + (Rs 2M remaining / Rs 6M in Year 3) = 2.33 years.
Decision Rule: If the firm’s maximum acceptable payback period is 3 years, this project qualifies. However, payback ignores cash flows after Year 3 (Rs 4M in Year 4), which could be significant.
B. Discounted Cash Flow (DCF) Methods
These account for the time value of money and are preferred in professional finance.
| Method | Formula | Decision Rule | Key Insight |
|---|---|---|---|
| Net Present Value (NPV) | NPV = Σ [CFₜ / (1 + r)ᵗ] – Initial Investment | Accept if NPV > 0 | Measures value added to shareholders |
| Internal Rate of Return (IRR) | IRR = Discount rate where NPV = 0 | Accept if IRR > Cost of Capital | Gives the break-even discount rate |
| Profitability Index (PI) | PI = PV of Future CFs / Initial Investment | Accept if PI > 1 | Ranks projects by bang per buck |
3. Deep Dive: NPV, IRR, and PI
A. Net Present Value (NPV)
NPV is the most theoretically sound method because it directly measures how much value a project adds to the firm.
Formula: Where:
- = Cash flow at time
- = Discount rate (usually WACC or cost of capital)
- = Initial investment (outflow)
Example: Gandaki Hydropower’s Turbine Upgrade Gandaki Hydropower Company (GTC) is considering upgrading its turbines at a cost of Rs 40 million. The upgrade will:
- Increase annual cash flows by Rs 10 million for 5 years.
- The cost of capital (WACC) is 12%.
Step-by-Step Calculation:
- Initial Investment (CF₀): -Rs 40M
- Annual Cash Flows (CF₁ to CF₅): Rs 10M each year
- Discount each cash flow at 12%:
- Year 1:
- Year 2:
- Year 3:
- Year 4:
- Year 5:
- Sum of PV of Cash Flows: 8.93 + 8.02 + 7.19 + 6.44 + 5.79 = 36.37M
- NPV: 36.37M – 40M = -3.63M
Decision: Since NPV = -Rs 3.63M (negative), GTC should reject this project. It destroys shareholder value.
Why NPV Works Best:
- Additive: NPV of multiple projects = Sum of individual NPVs.
- Directly ties to shareholder wealth: A positive NPV means the project is worth more than its cost.
B. Internal Rate of Return (IRR)
IRR is the discount rate that makes NPV = 0. It answers: "What return does this project generate?"
Formula (solved via trial, Excel, or financial calculator):
Example: Daraz’s New Warehouse in Pokhara Daraz is evaluating a Rs 50M warehouse with the following cash flows:
- Year 1: Rs 15M
- Year 2: Rs 20M
- Year 3: Rs 10M
Using Excel/Calculator:
- IRR = 21.4% (approximate).
Decision Rule:
- If IRR > Cost of Capital (WACC), accept.
- If IRR < WACC, reject.
Problem with IRR:
- Multiple IRRs: If cash flows change signs (e.g., - + - +), there can be multiple IRRs.
- Example: A project with CFs: -100, +150, -50. This has two IRRs (100% and -50%).
- Reinvestment Assumption: IRR assumes cash flows are reinvested at the IRR, which is often unrealistic.
- Cannot rank mutually exclusive projects: IRR may pick a shorter-lived project even if NPV is higher.
When to Use IRR:
- When comparing independent projects (not mutually exclusive).
- When quickly screening projects (but always verify with NPV).
C. Profitability Index (PI)
PI ranks projects by bang per buck—how much present value is generated per rupee invested.
Formula:
Example: Ncell’s 5G Expansion Ncell is choosing between two 5G projects:
- Project A: Rs 100M investment, PV of CFs = Rs 120M
- Project B: Rs 50M investment, PV of CFs = Rs 55M
Calculations:
- PI of A = 120M / 100M = 1.2
- PI of B = 55M / 50M = 1.1
Decision:
- Both have PI > 1, so both are profitable.
- Rank by PI: Project A (1.2) > Project B (1.1).
- Capital Rationing: If only Rs 100M is available, choose Project A (higher PI).
Advantages of PI:
- Useful when capital is limited.
- Easy to compare projects of different sizes.
Disadvantage:
- Like NPV, it assumes reinvestment at the discount rate.
4. Comparing NPV, IRR, and PI
| Criteria | NPV | IRR | PI |
|---|---|---|---|
| Time Value of Money | ✅ Yes | ✅ Yes | ✅ Yes |
| Decision Rule | Accept if NPV > 0 | Accept if IRR > WACC | Accept if PI > 1 |
| Handles Mutually Exclusive Projects | ✅ Best | ❌ Can mislead | ❌ Indirect (use with NPV) |
| Reinvestment Assumption | Reinvest at WACC (realistic) | Reinvest at IRR (unrealistic) | Reinvest at discount rate |
| Multiple Rates | ❌ No | ✅ Possible | ❌ No |
| Additivity | ✅ Yes (sum NPVs) | ❌ No | ❌ No |
| Best For | Primary method, theory-based | Quick screening, independent projects | Capital rationing |
5. Real-World Applications in Nepal
A. eSewa and Khalti: Digital Payment Infrastructure
- Investment: eSewa/Khalti spent millions building payment gateways, merchant integrations, and fraud detection systems.
- Capital Budgeting Used:
- NPV: Calculated the present value of future transaction fees (e.g., 1% per transaction) vs. initial tech costs.
- IRR: Determined if the 15-20% annual growth in users justified the investment.
- Risk: High initial costs, but network effects (more users → more merchants → more users) made it a high-PI project.
B. NTC’s Fiber-Optic Expansion
- Investment: Rs 20B+ to lay fiber across Nepal.
- NPV Analysis:
- Cash Flows: Future revenue from broadband subscriptions.
- Discount Rate: High (due to political risk), so NTC needed very high future cash flows to justify NPV > 0.
- Payback Period: ~10 years (long, but essential for national infrastructure).
C. Pathao’s Electric Scooter Fleet
- Investment: Rs 50M for 100 electric scooters.
- PI Calculation:
- PV of future ride revenues: Rs 60M
- Initial cost: Rs 50M
- PI = 60M / 50M = 1.2 → Very profitable.
- Risk: Scooter maintenance, battery costs, and driver training were modeled in sensitivity analysis.
D. NEPSE’s New Trading Terminal
- Investment: Rs 30M for a new trading system.
- NPV Conflict with IRR:
- NPV = +Rs 5M (positive, accept).
- IRR = 15%, but WACC = 18% → IRR < WACC → reject.
- Resolution: The project had lumpy cash flows (high upfront costs, then steady revenue). NPV was correct—the terminal generated enough long-term value despite a low IRR.
6. Advanced Topics
A. Mutually Exclusive Projects
When a firm cannot do both projects (e.g., Ncell choosing between 4G or 5G expansion), NPV is the best choice, not IRR.
Example: Kathmandu Retailers Ltd.
- Project X: Expand to Thapathali (NPV = Rs 8M, IRR = 20%)
- Project Y: Expand to Lakhami (NPV = Rs 10M, IRR = 18%)
Decision: Choose Project Y (higher NPV), even though its IRR is lower.
B. Capital Rationing
When a firm has limited funds (e.g., Rs 100M available), it must rank projects by PI or NPV per rupee.
Example: Gandaki Hydropower’s Budget Constraint
| Project | Cost (Rs M) | NPV (Rs M) | PI | Selected? |
|---|---|---|---|---|
| Turbine Upgrade | 40 | -3.63 | 0.91 | ❌ |
| Solar Farm | 30 | 5 | 1.17 | ✅ |
| Efficiency Retrofit | 25 | 4 | 1.16 | ✅ |
| Total | 55 | 9 |
Outcome: Only Solar Farm and Retrofit are selected (total cost Rs 55M < Rs 100M budget).
C. Risk and Capital Budgeting
Risk affects the discount rate and cash flow estimates.
| Risk Factor | Adjustment |
|---|---|
| High uncertainty (e.g., new tech) | Increase discount rate (e.g., +3-5%) |
| Sensitive to interest rates | Use sensitivity analysis |
| Political risk (e.g., hydropower in Nepal) | Higher WACC (e.g., 18% vs. 12%) |
Example: Ncell’s 5G Investment
- Base Case NPV: +Rs 200M (WACC = 12%)
- High-Risk Scenario (WACC = 18%): NPV = -Rs 50M → Reject.
- Solution: Phase the investment (start with a pilot in Kathmandu).
D. Post-Audit and Real Options
Even after approval, projects should be monitored and adjusted.
Real Options in Nepal:
- Option to Expand: If a retail store in Thapathali succeeds, Kathmandu Retailers can open more stores (like Daraz’s warehouse expansion).
- Option to Abandon: If a hydropower project underperforms, GTC can shut it down early (like NTC abandoning unprofitable fiber routes).
- Option to Delay: Wait for better tech (e.g., Ncell delaying 6G until costs drop).
7. Dividend Policy Link
Capital budgeting directly affects dividend policy. Firms follow the residual dividend model:
- Fund all positive-NPV projects first.
- Pay dividends only if cash remains after funding projects.
Example: Kathmandu Manufacturing Company (KMC)
- Net Income: Rs 15M
- Debt Ratio: 40% → Equity = Rs 60% of capital.
- Investment Opportunity: Rs 20M (but KMC only has Rs 9M in retained earnings).
- Solution:
- Fund Rs 9M from retained earnings.
- Issue new equity or debt for the remaining Rs 11M.
- Dividend = Rs 0 (residual dividend policy).
Formula: Where:
8. Exam Tip: How to Score Full Marks
A. Common Mistakes to Avoid
- Ignoring the time value of money: Always discount cash flows unless using payback.
- Miscounting cash flows: Remember:
- Cash Flow = Operating Cash Flow – Capital Expenditures + Depreciation Tax Shield.
- Terminal Cash Flow = PV of salvage value + Working Capital release.
- Assuming IRR > NPV always: They can conflict—always reconcile.
- Forgetting sunk costs: Exclude past expenses (e.g., R&D already spent).
- Incorrect discount rate: Use WACC unless specified otherwise.
B. Step-by-Step Answer Framework
For numerical questions (e.g., NPV, IRR, PI), follow this structure:
- State the formula clearly.
- List all given data (cash flows, discount rate, initial investment).
- Show calculations step-by-step (use tables for clarity).
- State the decision rule (e.g., "Accept if NPV > 0").
- Conclude with a recommendation.
Example Answer for a Past Exam Question:
Question: A firm has net income of Rs 15M. Its debt ratio is 40%. It has an investment opportunity of Rs 20M. What would be the dividend amount if it uses a residual dividend policy?
Answer:
- Debt Ratio = 40% → Equity = 60%.
- Required Retained Earnings = Investment × (1 – Debt Ratio) = 20M × 0.6 = Rs 12M.
- Dividend = Net Income – Required Retained Earnings = 15M – 12M = Rs 3M.
- Conclusion: The firm should pay a dividend of Rs 3 million after funding the project.
C. Short-Note Tips
For descriptive questions (e.g., "Features of optimal capital structure"), use:
- Bullet points for clarity.
- Real-world examples (e.g., "Like Ncell’s mix of debt and equity").
- Pros and cons (e.g., "High debt increases risk but lowers taxable income").
Example:
Question: Describe features of optimal capital structure.
Answer: The optimal capital structure balances cost of capital and risk to maximize firm value. Key features:
- Minimizes WACC: The mix of debt and equity that gives the lowest weighted average cost of capital.
- Trade-off between risk and return:
- More debt → Higher tax shields (interest is tax-deductible) but increased financial distress risk.
- More equity → Safer but expensive (dividends are not tax-deductible).
- Business risk matters: High-risk firms (e.g., hydropower) use less debt than low-risk firms (e.g., utilities like NTC).
- Flexibility: Firms like Daraz maintain low debt to stay agile for acquisitions.
- Market conditions: In high-interest-rate environments (e.g., post-2023 Nepal), firms reduce debt.
D. Graphs and Tables in Exams
- Always draw a table for cash flows:
| Year | Cash Flow (Rs M) | PV Factor (12%) | PV (Rs M) | |------|-------------------|-----------------|-----------| | 0 | -40 | 1.00 | -40.00 | | 1 | 10 | 0.893 | 8.93 | | 2 | 10 | 0.797 | 7.97 | | ... | ... | ... | ... | | NPV | | | **-3.63** | - For IRR conflicts, show a side-by-side NPV vs. IRR table:
| Project | NPV (Rs M) | IRR (%) | WACC (%) | Decision |
|---------|------------|---------|----------|----------|
| A       | +8         | 20      | 12       | Accept   |
| B       | +10        | 18      | 12       | Accept   |
| C       | -5         | 15      | 12       | Reject   |
9. Worked Example: Full Capital Budgeting Analysis
Scenario: Kathmandu Retailers Ltd. is considering expanding to Lalitpur with a new store. The initial investment is Rs 30 million, and the expected cash flows are:
| Year | Cash Flow (Rs M) |
|---|---|
| 0 | -30 |
| 1 | 8 |
| 2 | 10 |
| 3 | 12 |
| 4 | 5 |
Given:
- Cost of Capital (WACC) = 10%
- Tax Rate = 20%
- Salvage Value (Year 4) = Rs 2M
Step 1: Calculate Terminal Cash Flow (Year 4)
- Salvage Value: Rs 2M
- Working Capital Release: Rs 1M (assumed)
- Tax on Salvage: (2M × 20%) = Rs 0.4M
- Total Terminal CF: 2M + 1M – 0.4M = Rs 2.6M
Step 2: Compute NPV
| Year | Cash Flow (Rs M) | PV Factor (10%) | PV (Rs M) |
|---|---|---|---|
| 0 | -30 | 1.00 | -30.00 |
| 1 | 8 | 0.909 | 7.27 |
| 2 | 10 | 0.826 | 8.26 |
| 3 | 12 | 0.751 | 9.01 |
| 4 | 5 + 2.6 | 0.683 | 5.10 |
| NPV | -0.36 |
Step 3: Calculate IRR Using a financial calculator or Excel:
- IRR ≈ 9.8% (less than WACC of 10%).
Step 4: Profitability Index (PI)
- PV of Future CFs = 7.27 + 8.26 + 9.01 + 5.10 = Rs 29.64M
- PI = 29.64M / 30M = 0.99 (slightly < 1)
Decision:
- NPV = -Rs 0.36M → Reject (loses value).
- IRR (9.8%) < WACC (10%) → Reject.
- PI (0.99) < 1 → Reject.
But Wait! What If...?
- If the salvage value were higher (e.g., Rs 5M), NPV could turn positive.
- If the discount rate were lower (e.g., 8%), NPV = +Rs 2.5M → Accept.
Lesson: Always sensitivity-test assumptions!
10. Mermaid Diagram: The Capital Budgeting Process
flowchart TD
    A["Identify Investment Opportunities"] --> B["Estimate Cash Flows"]
    B --> C["Determine Discount Rate (WACC)"]
    C --> D["Choose Evaluation Method\n(NPV, IRR, PI, Payback)"]
    D --> E{"NPV > 0?"}
    E -->|"Yes"| F["Accept Project"]
    E -->|"No"| G["Reject Project"]
    F --> H["Monitor & Post-Audit"]
    G --> H
    H --> I["Adjust Future Decisions"]
11. In the Real World
eSewa’s Expansion:
- NPV Analysis: eSewa used NPV to justify its Rs 1.5B+ investment in digital payments, calculating the present value of future transaction fees (1% per Rs 100) against the cost of building merchant partnerships and fraud detection systems.
- Real Option: The ability to expand to insurance (eSewa Insurance) was a key strategic option.
NTC’s Fiber-Optic Rollout:
- IRR Challenge: NTC’s fiber projects had low IRRs (~10-12%) due to high upfront costs, but NPV was positive because the government subsidized infrastructure costs.
- Payback Period: ~10 years (long, but essential for Nepal’s digital economy).
Pathao’s Electric Scooter Fleet:
- PI Decision: Pathao calculated that each scooter had a PI > 1.2 when considering ride demand, maintenance costs, and battery replacement cycles.
- Risk Adjustment: Used a higher discount rate (18%) for scooters in high-theft areas like Kathmandu.
NEPSE’s Trading Terminal Upgrade:
- NPV vs. IRR Conflict: The new terminal had NPV = +Rs 5M but IRR = 15% (WACC = 18%). NEPSE accepted it because the long-term liquidity benefits outweighed the short-term IRR hurdle.
12. Exam Tip: Quick Reference Table
| Topic | Key Formula | Decision Rule | When to Use |
|---|---|---|---|
| NPV | Σ [CFₜ / (1 + r)ᵗ] – Initial Investment | Accept if NPV > 0 | Primary method, mutually exclusive projects |
| IRR | Find r where NPV = 0 | Accept if IRR > WACC | Independent projects, quick screening |
| PI | PV of CFs / Initial Investment | Accept if PI > 1 | Capital rationing |
| Payback | Years to recover initial investment | Accept if ≤ target payback period | Liquidity-focused firms |
| Discounted Payback | Years to recover PV of initial investment | Accept if ≤ target period | Better than payback, but limited use |
13. Final Checklist for Exams
Before submitting your answer:
- Did I label all cash flows correctly? (Initial investment is CF₀, outflows are negative.)
- Did I discount correctly? (Use the formula .)
- Did I reconcile NPV and IRR? (If they conflict, explain why.)
- Did I consider taxes? (Depreciation shields taxable income.)
- Did I assume working capital changes? (Often released at the end.)
- Did I use the right discount rate? (WACC unless specified.)
- Did I show all steps? (Examiners reward clarity.)
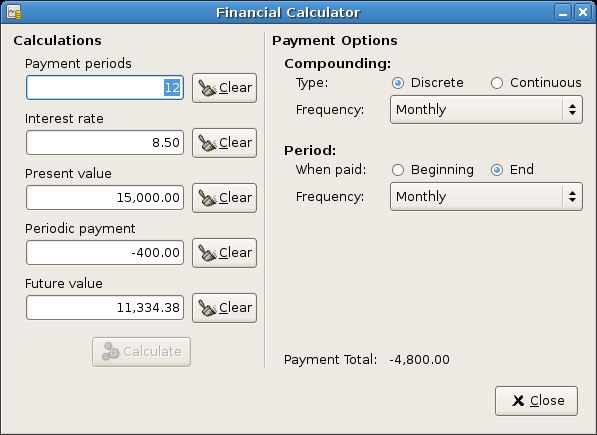 A typical HP 12C or Excel used for IRR/NPV calculations in Nepal’s finance exams. (Image: GPL, via Wikimedia Commons)
Based on the TU BBA syllabus for Financial Management (FIN207), unit 4.
Discussion
Loading…