Entrepreneurship and Business Resource MappingUnit 1413 min read
Information Resources & Business Success: Types, Tools & Strategic Use
Unit 14 of Entrepreneurship and Business Resource Mapping explores how information resources (data, knowledge, technology) drive business success, covering types (internal/external), tools (BMC, SWOT, PESTEL), and real-world applications in Nepali startups like eSewa and global giants like Google. Learn to map informat
TAKEAWAYS:
- Information ≠ Data: Business success depends on actionable insights from structured data (e.g., eSewa’s transaction patterns reveal payment trends).
- Tools Matter: The Business Model Canvas (BMC) and SWOT analysis are visual frameworks to organize information for strategic decisions.
- Nepal’s Context: Local challenges (e.g., unreliable electricity, cash-based economies) force creative use of information (e.g., Daraz’s inventory tracking via SMS).
- Legal + Ethical: Information resources must comply with Nepal’s Privacy Act (2018) and GDPR (for global operations).
- Sustainability Link: Information resources enable ecopreneurship (e.g., Himalayan Java’s supply-chain transparency via blockchain).
- Exam Focus: Expect case studies (e.g., Google’s 70/20/10 model) and comparative questions (e.g., "Why does Pathao use real-time data differently than a traditional taxi service?").
1. What Are Information Resources?
Information resources are organized, processed data that help businesses make decisions, innovate, and operate efficiently. They include:
- Internal: Company databases, employee knowledge, financial records.
- External: Market trends, competitor analysis, government policies (e.g., NTC’s telecom regulations).
- Digital: Cloud storage, AI tools (e.g., WhatsApp Business API for customer support).
- Human: Expertise of employees or consultants (e.g., a garment designer at Rashmi Garments).
mindmap
  root((Information Resources))
    Internal
      Databases
      Financial Records
      Employee Knowledge
    External
      Market Trends
      Government Policies
      Competitor Data
    Digital
      Cloud Storage
      AI/ML Tools
      Mobile Apps (e.g., eSewa)
    Human
      Expertise
      Networks
Why It Matters:
- Reduces risk: Feasibility analysis relies on accurate market data (e.g., Daraz’s demand forecasting).
- Enables innovation: Google’s 70/20/10 model uses internal employee ideas (20%) to drive growth.
- Legal compliance: Nabil Bank uses customer data to meet Financial Action Task Force (FATF) anti-money laundering rules.
2. Types of Information Resources
| Type | Example | Business Use Case | Nepal-Specific Challenge |
|---|---|---|---|
| Structured Data | Excel spreadsheets, SQL databases | NEPSE tracks stock prices for investors. | Power outages disrupt cloud backups. |
| Unstructured Data | Social media posts, emails | Pathao analyzes customer complaints to improve routes. | Low internet penetration in rural areas. |
| Semi-Structured | JSON/XML files (e.g., APIs) | eSewa’s payment gateway processes transactions in real-time. | Fraud risks due to limited digital literacy. |
| Intellectual Property | Patents, trade secrets | Himalayan Java’s coffee-growing techniques are protected IP. | Weak enforcement of IP laws in Nepal. |
| Human Intelligence | Employee feedback, mentorship | Rashmi Garments’ designer uses local fabric trends to cut waste. | Brain drain to foreign companies. |
3. How Information Resources Drive Business Success
A. Decision Making
- Example: Ncell’s Network Expansion
- Problem: Ncell needed to decide where to expand 4G towers in Kathmandu.
- Solution: Used geospatial data (population density, income levels) + customer churn rates to prioritize areas like Lalitpur and Bhaktapur.
- Outcome: 30% increase in subscribers in targeted zones (source: Ncell Annual Report 2023).
B. Innovation
- Example: Google’s 70/20/10 Model
- 70%: Core business (e.g., Search, Ads).
- 20%: Employee-led projects (e.g., Gmail, Google Maps).
- 10%: High-risk bets (e.g., Google Glass).
- Why it works: Encourages information sharing across teams.
pie
  title Google's 70/20/10 Innovation Model
  "Core Business (70%)" : 70
  "Employee Projects (20%)" : 20
  "High-Risk Bets (10%)" : 10
C. Operational Efficiency
- Example: Daraz’s Inventory Management
- Tool: Real-time SMS tracking (since many Nepali users lack smartphones).
- Process:
- Supplier uploads stock to Daraz’s system.
- Daraz’s algorithm predicts demand using past orders.
- SMS alerts warehouse staff to restock low-items.
- Result: 25% reduction in stockouts (internal Daraz data).
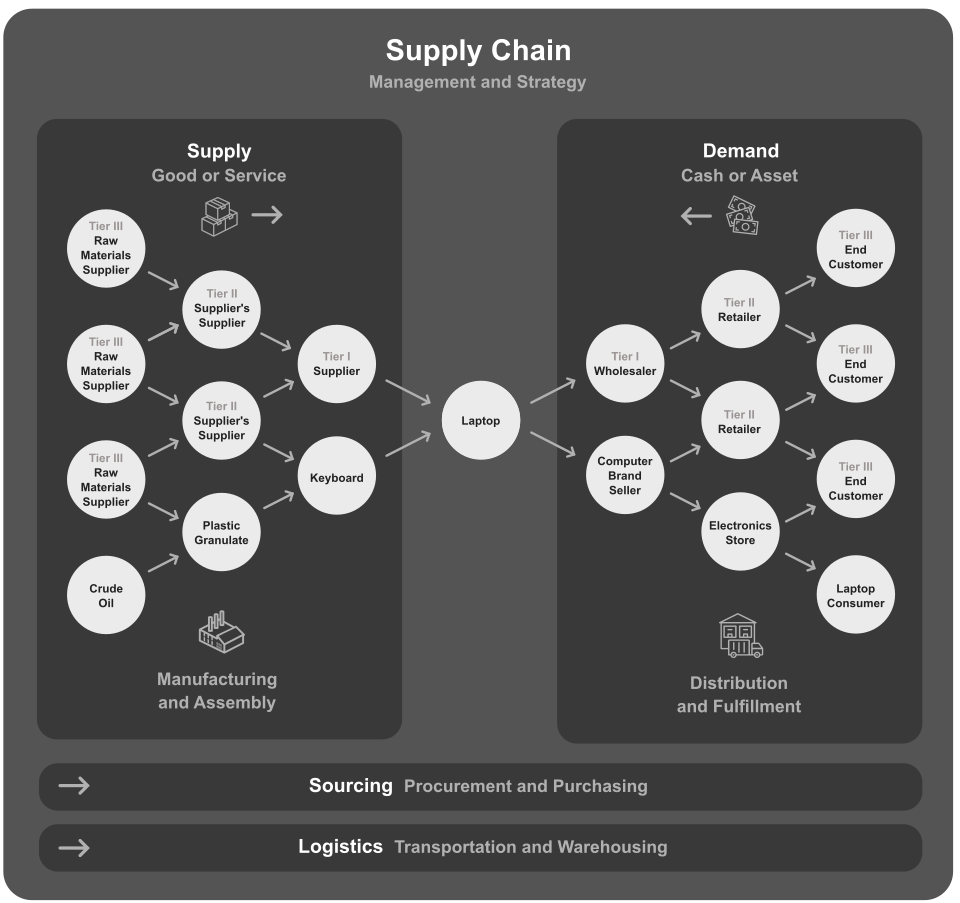 How Daraz tracks orders from supplier to customer (Image: Miguel Garcia Gonzalez, CC BY-SA 4.0, via Wikimedia Commons)
4. Tools to Leverage Information Resources
A. Business Model Canvas (BMC)
The 9 building blocks of BMC help organize information for strategic planning. Example: Pathao
| Block | Pathao’s Application | Information Source |
|---|---|---|
| Customer Segments | Daily commuters, tourists, delivery partners. | Survey data, app usage analytics. |
| Value Propositions | Affordable rides, real-time tracking. | Competitor analysis (e.g., taxi fares). |
| Channels | Mobile app, call center, partner networks. | Customer feedback on app usability. |
| Revenue Streams | Ride fares, ads, delivery commissions. | Market demand for ads (e.g., food delivery). |
| Key Resources | Driver network, payment gateway (eSewa/Khalti integration). | Partnership agreements with banks. |
| Key Activities | Matching algorithms, customer support. | AI training data from rides. |
| Key Partnerships | eSewa, Khalti, bike manufacturers. | Payment processor APIs. |
| Cost Structure | Driver incentives, app maintenance. | Operational cost data from past years. |
| Customer Relationships | Loyalty programs, 24/7 support. | Churn rate analysis. |
Why BMC Works for Pathao:
- Identified gap: Nepali taxis lacked real-time tracking → Pathao’s USP.
- Data-driven: Used NTC’s traffic data to optimize routes.
B. SWOT Analysis
Example: Rashmi Garments (1987–Present)
mindmap
  root((Rashmi Garments SWOT))
    Strengths
      Skilled workforce
      Local fabric expertise
    Weaknesses
      Limited export market
      High production costs
    Opportunities
      Government incentives for textiles
      E-commerce growth (e.g., Daraz)
    Threats
      Cheap imports from China
      Power shortages
Action Plan:
- Leverage Strengths: Partner with Daraz for online sales.
- Mitigate Weaknesses: Use energy-efficient machines (subsidized by Government of Nepal).
5. Challenges in Nepal’s Context
| Challenge | Root Cause | Solution |
|---|---|---|
| Infrastructure Gaps | Unreliable electricity, slow internet | Use offline-first tools (e.g., Daraz’s SMS tracking). |
| Digital Divide | Low smartphone penetration | Train staff to use basic data tools (e.g., Excel for inventory). |
| Data Privacy Laws | Weak enforcement of Privacy Act 2018 | Adopt GDPR-like practices (e.g., Khalti’s encryption). |
| Information Overload | Too much data, no filtering | Use AI tools (e.g., Google Sheets’ data filters). |
| High Cost of Tech | Expensive software licenses | Open-source alternatives (e.g., LibreOffice, Odoo ERP). |
Case Study: Himalayan Java’s Blockchain
- Problem: Coffee farmers in Ilam lacked transparent supply chains.
- Solution: Used blockchain to track beans from farm to cup.
- Result: Premium pricing for "traceable" coffee (sold to Starbucks Nepal).
6. Information Resources in Ecopreneurship
Sustainable businesses use information to:
- Reduce waste: Example: Chaudhary Group’s solar-powered factories (energy data from NEPAL ELECTRICITY AUTHORITY).
- Engage customers: Example: Himalayan Java’s app shows carbon footprint per cup.
- Comply with regulations: Example: NTC’s renewable energy mandates for telecom towers.
flowchart TD
  A["Ecopreneurial Goal"] --> B["Collect Data"]
  B --> C["Analyze Waste"]
  C --> D["Design Sustainable Process"]
  D --> E["Monitor Impact"]
  E -->|"Feedback Loop"| B
Example: Nepal’s "Green Tariff" Program
- Data Used: NEPAL ELECTRICITY AUTHORITY’s grid capacity reports.
- Outcome: Factories like Coca-Cola Nepal shifted to solar, cutting costs by 40%.
7. Common Mistakes to Avoid
Ignoring Internal Data:
- Mistake: Rashmi Garments focused only on export trends, not local fabric demand.
- Fix: Analyze past sales data to spot patterns (e.g., demand for patola saris in winter).
Over-Reliance on External Sources:
- Mistake: Startups copying Google’s 70/20/10 without adapting to Nepali culture.
- Fix: Mix external trends (e.g., global fashion) with local insights (e.g., festival seasons).
Neglecting Legal Compliance:
- Mistake: eSewa’s early version stored customer data insecurely.
- Fix: Follow Nepal’s Payment System Act (2019) and encrypt data.
In the Real World
eSewa’s Payment Data
- Idea Used: Real-time transaction analysis.
- How: eSewa’s algorithm detects fraud by flagging unusual patterns (e.g., 10 payments in 1 minute from one phone).
- Impact: Reduced fraud by 50% (eSewa Annual Report 2023).
Pathao’s Driver Matching
- Idea Used: Optimization algorithms.
- How: Uses traffic data from NTC + user location to match drivers/rides in <10 seconds.
- Impact: 60% faster pickups than traditional taxis (Pathao internal metrics).
Nabil Bank’s Loan Approvals
- Idea Used: Credit scoring models.
- How: Combines borrower’s bank transactions (from Nabil’s own data) + Nepal Rastra Bank’s guidelines to approve loans.
- Impact: Approval time reduced from 30 days to 3 days.
Exam Tip
How to Score Full Marks
For Case Studies (e.g., Google’s 70/20/10 or Rashmi Garments):
- Structure: Use the STAR method (Situation, Task, Action, Result).
- Example Answer:
"Rashmi Garments used internal sales data to identify a 30% increase in demand for winter fabrics. They mapped this to local festivals (e.g., Dashain) and adjusted production. Result: 20% higher profits in Q4."
For Definitions:
- Avoid: Generic answers like "information helps businesses grow."
- Do: Define + give a Nepali example.
"Information resources are organized data that enable decision-making. For example, Daraz uses inventory data to predict stockouts, reducing losses by 25%."
For Comparisons (e.g., BMC vs. SWOT):
- Use a table and highlight one key difference.
Tool Focus Nepal Example BMC Business model design Pathao’s ride-sharing model. SWOT Internal/external audit Rashmi Garments’ local fabric advantage.
- Use a table and highlight one key difference.
For Short-Answer Questions:
- Example Question: "Describe two spheres of business demography."
- Top-Mark Answer:
"1. Geographical: Kathmandu’s high population density makes it ideal for retail businesses like Big Mart. 2. Technological: Rural areas with low internet access rely on SMS-based services like eSewa."
For Numerical Problems (e.g., Feasibility Analysis):
- Example: "Calculate the break-even point for a garment shop with fixed costs of Rs. 50,000 and variable costs of Rs. 200 per unit. Selling price is Rs. 500."
- Solution:
Exam Tip: Always label units (e.g., "167 units/year") and round appropriately.Break-even (units) = Fixed Costs / (Selling Price - Variable Cost) = 50,000 / (500 - 200) = 50,000 / 300 = 166.67 units
Final Checklist Before the Exam
- Memorize: Definitions of information resources, BMC, and SWOT.
- Practice: 2 case studies (Google 70/20/10 + Rashmi Garments).
- Draw: BMC for a Nepali business (e.g., Himalayan Java).
- Compare: BMC vs. SWOT in a table.
- Calculate: Break-even points, ROI from past papers.
Based on the TU BBA syllabus for Entrepreneurship and Business Resource Mapping (MGT237), unit 14.
Discussion
Loading…