Investment AnalysisUnit 58 min read
Risk & Return: Portfolio Theory (Modern Portfolio Analysis)
Unit 5 of Investment Analysis: Explores how investors combine assets to optimize returns while managing risk, using diversification, covariance, and the Capital Market Line (CML) to construct efficient portfolios.
TAKEAWAYS:
- Risk in portfolios is not the sum of individual risks but depends on how assets move together (covariance).
- The efficient frontier shows the best risk-return trade-offs for risky assets alone.
- Adding a risk-free asset (like government bonds) creates the Capital Market Line (CML), the global minimum-variance frontier.
- Beta measures a stock’s sensitivity to market risk, while alpha reflects excess return after adjusting for risk.
- Diversification reduces unsystematic risk but cannot eliminate systematic risk.
- The Markowitz model mathematically optimizes portfolios by minimizing variance for a given return.
1. Defining Risk and Return in Portfolios
Risk in investment analysis is the uncertainty of future returns. Unlike single assets, portfolios combine multiple assets, and their total risk depends on how their returns fluctuate together.
Types of Risk
- Unsystematic (Idiosyncratic) Risk: Unique to a company or industry (e.g., a Daraz supply chain disruption).
- Systematic (Market) Risk: Affects the entire market (e.g., Nepal Rastra Bank’s interest rate hike).
- Diversifiable Risk: Can be reduced by combining assets (e.g., holding both Ncell and NTC stocks).
- Non-Diversifiable Risk: Cannot be eliminated (e.g., economic recession).
flowchart TD
    A["Total Risk"] --> B["Unsystematic Risk"]
    A --> C["Systematic Risk"]
    B --> D["Example: Daraz's delivery delays"]
    C --> E["Example: NEPSE crash"]
2. Portfolio Return Calculation
The expected return of a portfolio is a weighted average of individual asset returns.
Formula: where:
- = weight of asset in the portfolio,
- = expected return of asset .
Worked Example: Suppose you invest 60% in Alpha Bank (expected return = 10%) and 40% in Beta Bank (expected return = 15%). Calculate the portfolio return:
3. Portfolio Risk: Variance and Covariance
Portfolio risk is not the sum of individual variances but depends on covariance (how returns move together).
Formula for Portfolio Variance: where:
- = variance of asset ,
- = covariance between assets and .
Key Insight:
- If two assets have negative covariance, their risks cancel out (diversification works).
- If covariance is zero, risk is simply the weighted sum of individual risks.
Real-World Example:
- NTC and Ncell: If one’s stock price rises when the other falls (due to regulatory shifts), their covariance is negative, reducing portfolio risk.
4. The Efficient Frontier
The efficient frontier is the set of portfolios offering the highest expected return for a given level of risk (or lowest risk for a given return).
flowchart TD
    A["Portfolio Risk"] --> B["Unsystematic Risk Decreases"]
    A --> C["Systematic Risk Remains"]
    B --> D["Diversification reduces unsystematic risk"]
    C --> E["Market-wide risk (e.g., NEPSE crash) still affects all assets"]
How to Plot It:
- Calculate expected returns and variances for all possible combinations.
- Plot risk (variance) vs. return for each portfolio.
- The highest return for each risk level forms the efficient frontier.
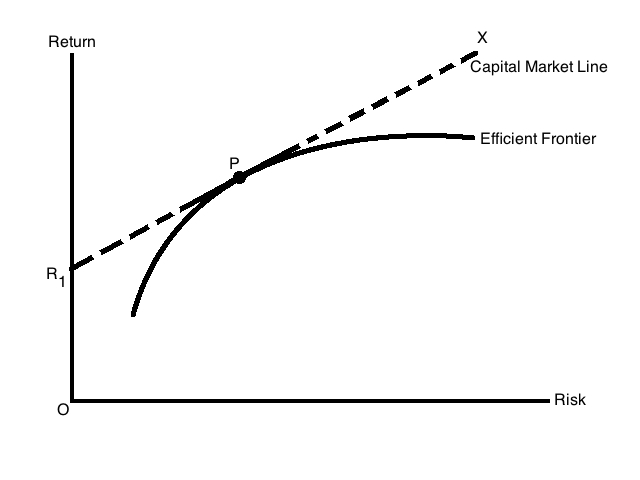 Shows how diversification improves risk-return trade-off (Image: Parthiv.ravindran, CC BY-SA 3.0, via Wikimedia Commons)
5. The Capital Market Line (CML)
The CML extends the efficient frontier by adding a risk-free asset (e.g., government bonds). It represents the global minimum-variance frontier.
Key Properties:
- The tangency point (where CML touches the efficient frontier) is the optimal risky portfolio.
- Any portfolio on the CML is a mix of this optimal risky portfolio and the risk-free asset.
Formula for CML Slope (Sharpe Ratio):
Worked Example:
- Suppose the optimal risky portfolio has and .
- The risk-free rate .
- The Sharpe Ratio = .
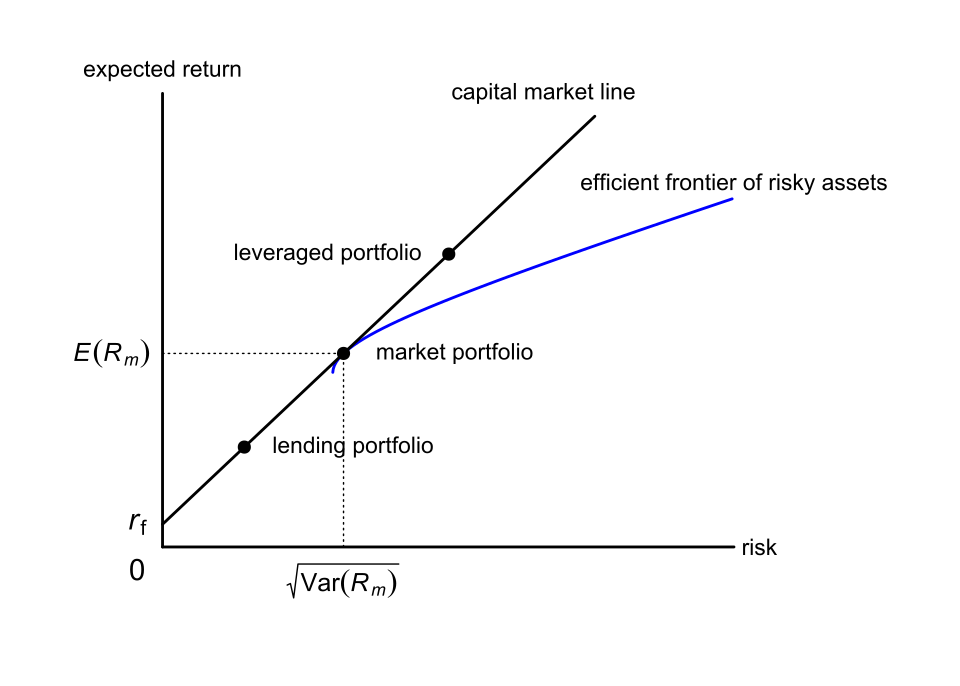 Shows risk-free asset, optimal portfolio, and CML slope (Image: Munasca, CC BY-SA 4.0, via Wikimedia Commons)
6. Beta and Market Risk
Beta () measures a stock’s sensitivity to market movements:
- : Stock moves with the market.
- : Stock is more volatile (e.g., Mega Company, ).
- : Stock is less volatile (e.g., utility stocks).
Required Rate of Return (CAPM): where:
- = risk-free rate,
- = market return,
- = market risk premium.
Worked Example:
- Mega Company: , , .
- Required return:
7. Diversification and Correlation
Correlation () measures how two assets move together:
- : Perfect positive correlation (e.g., two stocks in the same sector).
- : Perfect negative correlation (rare, but possible with inverse ETFs).
- : No relationship.
Diversification Effect:
- High correlation → Little risk reduction.
- Low correlation → Significant risk reduction.
Example:
- Fund A: , .
- Fund B: , , .
- If invested 50-50, portfolio variance is lower than the average of individual variances.
8. Practical Applications
In the Real World
Nepal Investment Bank’s Portfolio Management:
- Uses portfolio theory to allocate funds across stocks, bonds, and real estate to balance risk and return.
- Example: If NEPSE is volatile, they may reduce stock exposure and increase bonds (risk-free asset).
Daraz’s Supply Chain Diversification:
- Daraz holds inventory across multiple warehouses (e.g., Kathmandu, Pokhara, Biratnagar).
- If one warehouse faces a flood (unsystematic risk), others compensate, reducing total risk.
Pathao’s Ride-Sharing Risk Mitigation:
- Pathao diversifies drivers across cities (Kathmandu, Lalitpur, Bhaktapur).
- If demand drops in one city (e.g., due to traffic restrictions), revenue from other cities stabilizes.
9. Exam Tips
Memorize Key Formulas:
- Portfolio return, variance, covariance, CAPM, Sharpe Ratio.
- Example: For Alpha Bank vs. Beta Bank, always calculate expected return and portfolio variance.
Understand Efficient Frontier vs. CML:
- Efficient frontier = only risky assets.
- CML = risky assets + risk-free asset.
Beta Interpretation:
- If a stock has , it’s more risky than the market.
- Use CAPM to find required return.
Diversification Trick:
- If two assets have negative covariance, their combined risk is less than the sum of individual risks.
Worked Example Practice:
- Always show calculations for portfolio return, variance, and beta.
- Example: For Nabina Basnet’s ABC stock, calculate total rupee return and holding period return.
Common Pitfalls:
- Assuming risk adds linearly (it doesn’t—covariance matters).
- Ignoring the risk-free asset in CML questions.
Final Note: Portfolio theory is not just math—it’s about real-world decision-making. Banks, mutual funds, and even eSewa’s investment arm use these principles to grow wealth while managing risk. Always connect theory to examples in exams!
Based on the TU BBA syllabus for Investment Analysis (BNK204), unit 5.
Discussion
Loading…