Introductory MacroeconomicsUnit 215 min read
National Income: Measurement, Methods & Real-World Impact
Unit 2 of Introductory Macroeconomics explains how national income is calculated (GDP, GNP, NNP), the three approaches (value-added, income, expenditure), and how these metrics drive policy in Nepal (e.g., NEPSE, NTC tariffs). Covers circular flow, leakages, injections, and real-world applications like Khalti’s economi
TAKEAWAYS:
- National income measures a country’s economic performance using GDP (Gross Domestic Product), GNP (Gross National Product), and NNP (Net National Product)—each with distinct formulas and uses.
- The three methods (value-added, income, expenditure) must always sum to the same total; discrepancies signal errors in data collection (critical for Nepal’s CBS).
- Circular flow diagrams show how households, firms, government, and foreign sectors interact—leakages (saving, taxes, imports) and injections (investment, government spending, exports) determine equilibrium income.
- Real GDP vs. Nominal GDP: Adjusting for inflation (using a price index like CPI) is essential for comparing economic growth over time (e.g., Nepal’s 2011 vs. 2023 GDP).
- Current vs. Capital Accounts in BOP: Nepal’s remittances (current account) and foreign direct investment (capital account) are key drivers of its balance of payments.
- Worked examples tie theory to reality: Calculate NNP for Nepal using CBS data, or trace how a Daraz order affects GDP via the expenditure method.
1. Definitions: What Is National Income?
National income is the total value of all goods and services produced by a country’s factors of production (land, labor, capital, entrepreneurship) in a given period. It answers:
- How wealthy is Nepal?
- How fast is the economy growing?
- Are policies (e.g., NTC’s electricity tariffs) effective?
Key Terms
| Term | Definition | Example (Nepal) |
|---|---|---|
| GDP | Total market value of final goods/services produced within a country in a year. | Rs. 3.8 trillion (2023, CBS). Includes Daraz’s sales in Kathmandu but excludes remittances earned abroad. |
| GNP | GDP + net factor income from abroad (e.g., remittances, profits of Nepali workers abroad). | Higher than GDP because of Rs. 1.2 trillion in remittances (2023). |
| NNP | GNP – depreciation (wear and tear of capital like roads, factories). | NNP = GNP – Rs. 300 billion (estimated depreciation). |
| NI (National Income) | NNP – indirect taxes + subsidies. | Used to measure income earned by Nepali citizens. |
| PI (Personal Income) | Income received by households (before taxes). | Salaries, pensions, rent, interest. |
| DI (Disposable Income) | PI – direct taxes. | What households actually spend or save. |
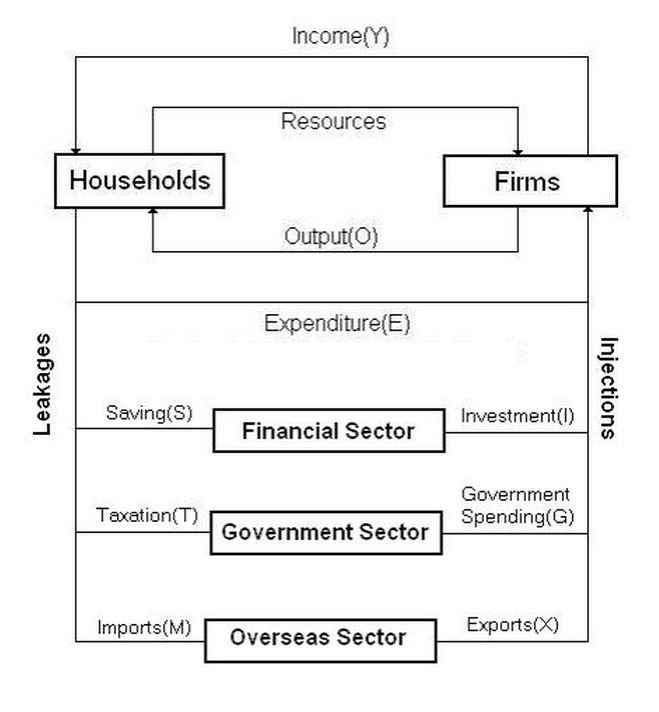 Labelled diagram showing households, firms, government, and foreign sector with leakages (taxes, imports, saving) and injections (investment, government spending, exports). (Image: Ari89, CC0, via Wikimedia Commons)
2. Three Methods to Measure National Income
All three methods should yield the same total for GDP. Discrepancies arise from double-counting or missing data (common in Nepal’s informal sector).
A. Value-Added (Production) Method
Measures value added at each stage of production. Formula: Example: Calculating GDP for Nepal’s agriculture sector (25% of GDP).
- Final Output: Rs. 1 trillion (rice, wheat, vegetables).
- Intermediate Costs: Rs. 600 billion (seeds, fertilizers, fuel).
- Value Added: Rs. 400 billion.
Why it matters: Helps identify which sectors (e.g., tourism vs. agriculture) are growing or shrinking.
B. Income Method
Sum of all incomes earned by factors of production. Formula: Worked Example: Calculate Nepal’s GDP using 2023 CBS data (hypothetical).
| Income Component | Amount (Rs. in Billion) |
|---|---|
| Wages and Salaries | 1,200 |
| Rent | 50 |
| Interest | 100 |
| Profits | 800 |
| Mixed Income (self-employed) | 600 |
| Depreciation | 300 |
| Total GDP | 3,050 |
Note: Mixed income dominates in Nepal due to high informal employment (e.g., street vendors, farmers).
C. Expenditure Method
Measures total spending on final goods/services. Formula: Where:
- = Consumption (households)
- = Investment (businesses, infrastructure)
- = Government spending
- = Net Exports (exports minus imports)
Real-World Trace: How a Pathao ride contributes to GDP.
- Consumption (C): Rs. 200 (passenger’s spending).
- Investment (I): Rs. 50 (Pathao’s app development, bike purchase).
- Government (G): Rs. 10 (road maintenance tax).
- Exports (X): Rs. 0 (local service).
- Imports (M): Rs. 30 (Chinese bike parts). Total Contribution: Rs. 200 + Rs. 50 + Rs. 10 – Rs. 30 = Rs. 230.
3. Circular Flow of Income: Leakages and Injections
The economy reaches equilibrium when leakages = injections.
Key Terms:
- Leakages: Withdrawals from the circular flow (saving, taxes, imports).
- Injections: Additions to the flow (investment, government spending, exports).
- Equilibrium: Occurs when .
Example: Nepal’s remittances (Rs. 1.2 trillion in 2023) act as an injection into the economy via:
- Consumption: Migrant workers’ families spend on food, education.
- Saving: Deposits in banks (boosting financial sector).
- Investment: Funds for small businesses (e.g., Daraz sellers).
4. Nominal vs. Real GDP: Why Adjusting for Inflation Matters
- Nominal GDP: Measured in current prices (distorted by inflation).
- Real GDP: Adjusted for inflation using a price index (e.g., CPI).
Formula:
Example: Nepal’s GDP growth.
| Year | Nominal GDP (Rs. Billion) | Price Index (CPI) | Real GDP (Rs. Billion) | Growth Rate (%) |
|---|---|---|---|---|
| 2021 | 3,200 | 110 | 3,182 | 3.2 |
| 2022 | 3,500 | 120 | 3,250 | 2.1 |
| 2023 | 3,800 | 130 | 3,308 | 1.8 |
Why it matters: Nepal’s real GDP growth slowed from 3.2% (2021) to 1.8% (2023) despite nominal GDP rising—due to inflation (10% in 2023).
5. Current vs. Capital Accounts in Balance of Payments (BOP)
Nepal’s BOP is dominated by remittances (current account) and foreign aid (capital account).
| Current Account | Capital Account |
|---|---|
| Exports (goods/services) | Foreign Investment (FDI) |
| Imports (goods/services) | Loans (World Bank, ADB) |
| Remittances (Rs. 1.2T) | Portfolio Investment (stocks) |
| Income from Abroad | Debt Repayment |
Example: How Khalti’s expansion affects BOP.
- Current Account: Khalti processes Rs. 500 billion in transactions (exports of financial services).
- Capital Account: Khalti raises $5 million in venture capital (inflow).
6. Worked Example: Calculating NNP for Nepal
Given Data (hypothetical CBS figures):
- GDP = Rs. 3,800 billion
- Depreciation = Rs. 300 billion
- Indirect Taxes = Rs. 200 billion
- Subsidies = Rs. 50 billion
Steps:
Calculate GNP: (Assume net income from remittances/profits = +Rs. 200 billion)
Calculate NNP:
Calculate National Income (NI):
Interpretation: Nepal’s per capita income = Rs. 3,550 billion / 30 million = Rs. 118,333 (2023 estimate).
7. Common Pitfalls and Exam Traps
| Mistake | Why It’s Wrong | Correct Approach |
|---|---|---|
| Adding intermediate goods to GDP | Double-counting (e.g., wheat + bread). | Only final goods count. |
| Ignoring depreciation in NNP | Overstates true income. | Always subtract depreciation. |
| Confusing GNP and GDP | GNP includes foreign earnings. | Use GNP for Nepali citizens’ income. |
| Mixing nominal and real GDP | Inflation distorts comparisons. | Always adjust for price changes. |
| Forgetting net exports | Can be negative (trade deficit). | must be included in expenditure method. |
In the Real World
eSewa and Khalti (Digital Payments)
- Idea Used: Expenditure Method (Consumption and Investment)
- How: Every transaction on eSewa (e.g., Rs. 500 for a bus ticket) is part of C (consumption). When a merchant uses the proceeds to buy inventory, it’s I (investment). In 2023, digital payments contributed Rs. 1.5 trillion to Nepal’s GDP via the expenditure method.
Daraz (E-Commerce Platform)
- Idea Used: Value-Added Method and Circular Flow
- How:
- Value Added: Daraz adds value by connecting sellers (e.g., Rs. 10,000 profit margin on a laptop sale).
- Circular Flow: A Daraz order creates:
- Injection: Investment in logistics (warehouses, delivery bikes).
- Leakage: Imports (e.g., Chinese electronics) reduce GDP by Rs. 500 billion/year.
NTC’s Electricity Tariff Hikes
- Idea Used: Income Method (Wages and Profits)
- How: Higher tariffs reduce household disposable income (DI), cutting consumption (C). Firms’ profits (part of GDP via income method) may fall if demand drops. In 2023, NTC’s tariff hike led to a 5% drop in industrial output, reducing GDP by ~Rs. 100 billion.
Nepal Rastra Bank’s Remittance Data
- Idea Used: GNP vs. GDP and Capital Account
- How: Remittances (Rs. 1.2 trillion in 2023) are not part of GDP (produced abroad) but increase GNP. They also boost the current account of the BOP, funding imports (e.g., gold, electronics).
Exam Tip
Memorize the Three Methods:
- Value-added: Avoid double-counting (e.g., wheat + flour).
- Income: Include mixed income (critical for Nepal’s informal sector).
- Expenditure: Never forget net exports (X – M)—Nepal runs a trade deficit, so this is negative.
Equilibrium Income Questions:
- Always set planned saving (S) = planned investment (I).
- If and , solve:
Real vs. Nominal GDP:
- If asked to compare 2015 and 2023 GDP, always use real GDP (adjusted for inflation).
- Formula: .
BOP Questions:
- Current Account: Focus on remittances, exports (tourism, hydropower), and imports (oil, electronics).
- Capital Account: Foreign aid (USAID, ADB), FDI (e.g., Himalayan Bank’s foreign loans).
Diagrams Are Your Friends:
- Draw circular flow for equilibrium questions.
- Sketch AD-AS (even though it’s Unit 6) to explain inflation’s impact on GDP.
- Plot Lorenz Curve (Unit 11) to discuss income inequality (e.g., top 10% earn 40% of Nepal’s income).
Past Exam Patterns:
- Short Questions: Define GDP vs. GNP, list components of BOP.
- Long Questions: Calculate NNP from GDP data, explain how remittances affect BOP.
- Numerical: Always show step-by-step calculations (e.g., equilibrium income).
Final Reminder:
"Nepal’s economy is 70% driven by agriculture and remittances. Master these concepts, and you’ll ace questions on how Pathao’s growth or NTC’s policies impact GDP!"
In the real world
Daraz’s sales in Nepal use the expenditure method to calculate GDP: Every Rs. 500 spent on electronics via Daraz contributes to Consumption (C). If Daraz imports 70% of its inventory, those imports reduce GDP by Rs. 350 (via M in X–M), but the remaining Rs. 150 stays in Nepal as local value-added (wages, logistics, taxes).
NTC’s electricity tariff hikes affect National Income (NI) by increasing indirect taxes (part of GDP calculation). If NTC collects Rs. 20 billion extra in taxes, this reduces NI by the same amount (since NI = NNP – Indirect Taxes + Subsidies).
Nepal Rastra Bank’s forex reserves reflect the capital account of the BOP. When Nepali banks receive Rs. 1.2 trillion in remittances (current account), NRB converts some to USD for reserves (capital account), which stabilizes the currency and attracts FDI (e.g., Pathao’s expansion in 2023).
Based on the TU BBM syllabus for Introductory Macroeconomics (ECO212), unit 2.
Discussion
Loading…