Basic FinanceUnit 316 min read
Financial Statements & Analysis: Types, Formats & Insights
Unit 3 of Basic Finance explores the three core financial statements (Income Statement, Balance Sheet, Cash Flow Statement), their formats, preparation methods, and analytical techniques like ratio analysis, with Nepali business examples and exam-focused visuals.
TAKEAWAYS
- The Income Statement (P&L) shows profitability over time using revenue – expenses = net income, while the Balance Sheet is a snapshot of assets = liabilities + equity at a point in time.
- Cash Flow Statement tracks operating, investing, and financing activities—crucial for liquidity analysis, unlike accrual-based Income Statements.
- Journal entries (debit/credit rules) feed into ledger accounts (T-accounts), which summarize into trial balances before final statements.
- Horizontal/vertical analysis and ratio analysis (e.g., liquidity, profitability, leverage) reveal trends and financial health—exam favorites!
- Adjusting entries (accruals, deferrals, estimates) ensure GAAP compliance and accurate statement presentation.
- Real-world tie: eSewa’s cash flow (operating: transactions; investing: tech upgrades; financing: loans) mirrors the statement’s structure.
1. The Three Core Financial Statements
Financial statements are the "language of business"—they communicate performance, position, and cash flows to stakeholders. Tribhuvan University exams test format, preparation, and interpretation of these three:
A. Income Statement (Profit & Loss Statement)
Definition: A summary of revenue, expenses, and net income over a specific period (monthly/annually). It answers: "Did the business make a profit or loss?"
Key Components (with Nepali business example: "Kathmandu Retail Pvt. Ltd."):
| **Particulars**               | **Amount (NPR ’000)** | **Dr/Cr** |
|-------------------------------|-----------------------|-----------|
| **Sales Revenue**             | 50,000                | Cr        |
| **Less: Cost of Goods Sold (COGS)** | 30,000          | Dr        |
| **Gross Profit**              | 20,000                |           |
| **Less: Operating Expenses**  |                       |           |
| - Rent                       | 5,000                 | Dr        |
| - Salaries                   | 8,000                 | Dr        |
| - Utilities                  | 2,000                 | Dr        |
| **Operating Income**          | 5,000                 |           |
| **Less: Interest Expense**    | 1,000                 | Dr        |
| **Net Income Before Tax**     | 4,000                 |           |
| **Less: Income Tax (25%)**    | 1,000                 | Dr        |
| **Net Income**                | **3,000**             |           |
How It Works:
- Revenue (sales, services) is credited (increases equity).
- Expenses (COGS, salaries, rent) are debited (reduce equity).
- Net Income = Revenue – Expenses – Taxes.
Real-World Link:
- Daraz Nepal’s Income Statement shows gross profit from sales minus logistics costs (operating expenses) and platform fees (financing costs) to arrive at net profit—critical for investor reports.
B. Balance Sheet (Statement of Financial Position)
Definition: A snapshot of a company’s assets, liabilities, and equity at a specific date (e.g., 31 Dec 2023). It satisfies: Assets = Liabilities + Owner’s Equity
Key Components (for Kathmandu Retail Pvt. Ltd.):
| **Assets**                     | **Amount (NPR ’000)** | **Liabilities & Equity**       | **Amount (NPR ’000)** |
|--------------------------------|-----------------------|--------------------------------|-----------------------|
| **Current Assets**             |                       | **Current Liabilities**        |                       |
| - Cash                        | 10,000                | - Accounts Payable             | 5,000                 |
| - Accounts Receivable         | 8,000                 | - Short-term Loan              | 10,000                |
| - Inventory                   | 12,000                | **Total Current Liabilities**  | **15,000**            |
| **Total Current Assets**       | **30,000**            | **Long-term Liabilities**      |                       |
| **Non-Current Assets**        |                       | - Bank Loan (5 years)          | 20,000                |
| - Property, Plant & Equipment  | 50,000                | **Total Liabilities**          | **35,000**            |
| - Less: Accumulated Depreciation | 10,000          | **Owner’s Equity**            |                       |
| **Net Non-Current Assets**     | **40,000**            | - Capital Stock                | 30,000                |
| **Total Assets**               | **70,000**            | - Retained Earnings            | 5,000                 |
|                                |                       | **Total Equity**               | **35,000**            |
|                                |                       | **Total Liabilities + Equity** | **70,000**            |
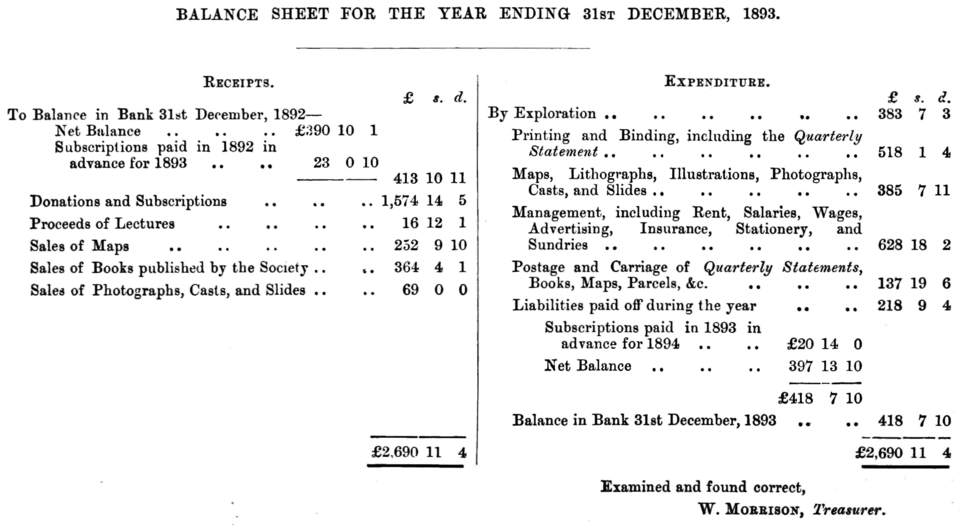 Classical accounting equation visualized (Image: Public domain, via Wikimedia Commons)
How It Works:
- Assets are resources (cash, inventory, equipment).
- Liabilities are debts (loans, payables).
- Equity = Owner’s claim (capital + retained earnings).
Real-World Link:
- NTC’s Balance Sheet shows:
- Assets: Power plants, transmission lines (non-current).
- Liabilities: Government loans (long-term), bills to suppliers (current).
- Equity: Government ownership (capital stock).
C. Cash Flow Statement
Definition: Tracks actual cash inflows and outflows over a period, divided into three sections:
- Operating Activities (core business cash flows).
- Investing Activities (buying/selling assets).
- Financing Activities (loans, dividends, stock issuance).
Format (for Kathmandu Retail Pvt. Ltd.):
| **Section**                  | **Cash Inflow (+)** | **Cash Outflow (-)** | **Net Cash Flow** |
|------------------------------|---------------------|----------------------|-------------------|
| **Operating Activities**     |                     |                      |                   |
| - Cash from Customers        | 52,000              |                      |                   |
| - Cash Paid to Suppliers     |                     | 32,000               |                   |
| - Salaries Paid              |                     | 8,000                |                   |
| **Net Cash from Operations** |                     |                      | **12,000**        |
| **Investing Activities**     |                     |                      |                   |
| - Purchase of Equipment      |                     | 10,000               |                   |
| **Net Cash from Investing**  |                     |                      | **-10,000**       |
| **Financing Activities**     |                     |                      |                   |
| - Loan Received              | 10,000              |                      |                   |
| - Dividends Paid             |                     | 1,000                |                   |
| **Net Cash from Financing**  |                     |                      | **9,000**         |
| **Net Change in Cash**       |                     |                      | **11,000**        |
| **Cash at Beginning**        |                     |                      | 10,000            |
| **Cash at End**              |                     |                      | **21,000**        |
Why It Matters:
- Accrual accounting (Income Statement) records revenue when earned, but Cash Flow Statement shows when cash is received.
- Example: eSewa records transaction fees as revenue when services are rendered, but cash flow depends on NPR collection timing.
2. The Accounting Cycle: From Transactions to Financial Statements
The process of recording, summarizing, and reporting financial data follows a cycle. Here’s how it works for Pathao’s Nepal operations:
flowchart TD
    A["1. Business Transactions\n(e.g., Driver earns NPR 50,000)"]
    B["2. Journal Entries\nDebit: Cash Cr: Revenue"]
    C["3. Post to Ledger\n(T-accounts for Cash, Revenue)"]
    D["4. Trial Balance\nCheck Dr = Cr"]
    E["5. Adjusting Entries\n(e.g., Depreciation, Accruals)"]
    F["6. Adjusted Trial Balance"]
    G["7. Prepare Financial Statements\nIncome Statement, Balance Sheet, Cash Flow"]
    H["8. Closing Entries\nTransfer Net Income to Retained Earnings"]
    I["9. Post-Closing Trial Balance\nZero out temporary accounts"]
    A --> B --> C --> D --> E --> F --> G --> H --> I
Key Steps Explained:
Journal Entries: Record transactions in debit/credit format.
- Rule: Debit = Left, Credit = Right; Dr increases assets/expenses, Cr increases liabilities/revenue/equity.
- Example:
| **Date** | **Particulars**               | **Dr (NPR)** | **Cr (NPR)** |
|----------|-------------------------------|--------------|--------------|
| 2023-10-01 | Cash Sales                    |              | 20,000       |
| 2023-10-01 | Cash                           | 20,000       |              |
Ledger (T-Accounts):
- Cash Account:
Cash Dr | Cr -------- 20,000 | 5,000 (Rent Paid) Balance: 15,000 Dr - Revenue Account:
Sales Revenue
Dr | Cr
--------
| 20,000
Balance: 20,000 Cr
- Cash Account:
Trial Balance: Lists all ledger balances to ensure Dr = Cr.
| **Account**       | **Dr (NPR)** | **Cr (NPR)** |
|-------------------|--------------|--------------|
| Cash              | 15,000       |              |
| Accounts Receivable | 8,000      |              |
| Sales Revenue     |              | 20,000       |
| Rent Expense      | 5,000        |              |
| **Total**         | **28,000**   | **28,000**   |
Adjusting Entries: Ensure accrual accounting (e.g., unearned revenue, depreciation).
- Example: Ncell’s Depreciation on cell towers:
| **Date** | **Particulars**               | **Dr (NPR)** | **Cr (NPR)** |
|----------|-------------------------------|--------------|--------------|
| 2023-12-31 | Depreciation Expense          | 500,000      |              |
| 2023-12-31 | Accumulated Depreciation      |              | 500,000      |
- Example: Ncell’s Depreciation on cell towers:
Financial Statements: Prepared from adjusted trial balance.
3. Financial Statement Analysis Techniques
Exams test interpretation—not just preparation. Key methods:
A. Horizontal Analysis (Trend Analysis)
Compares financial data over time (e.g., 3 years) to identify growth/decline trends.
Example: Nepal Stock Exchange (NEPSE) Index Growth:
| **Year** | **Net Income (NPR ’000)** | **% Change** |
|----------|--------------------------|--------------|
| 2021     | 15,000                   | -            |
| 2022     | 18,000                   | +20%         |
| 2023     | 22,500                   | +25%         |
Insight: NEPSE’s net income grew 25% YoY—indicating improving profitability.
B. Vertical Analysis (Common-Size Statements)
Expresses each line item as a % of a base (e.g., sales for Income Statement, total assets for Balance Sheet).
Example: Khalti’s Income Statement (Vertical Analysis):
| **Item**               | **Amount (NPR ’000)** | **% of Sales** |
|------------------------|----------------------|----------------|
| Sales Revenue           | 50,000               | 100%           |
| COGS                    | 30,000               | 60%            |
| Gross Profit            | 20,000               | 40%            |
| Operating Expenses      | 15,000               | 30%            |
| Net Income              | 5,000                | 10%            |
Insight: COGS is 60% of sales—high, but gross profit margin (40%) is stable.
C. Ratio Analysis
Liquidity Ratios (Can the company pay short-term debts?):
- Current Ratio = Current Assets / Current Liabilities
- Kathmandu Retail: 30,000 / 15,000 = 2.0 (Good: >1.5)
- Quick Ratio = (Current Assets – Inventory) / Current Liabilities
- Kathmandu Retail: (30,000 – 12,000) / 15,000 = 1.2 (Acceptable: >1.0)
Profitability Ratios (Is the company earning enough?):
- Gross Profit Margin = (Revenue – COGS) / Revenue
- Kathmandu Retail: (50,000 – 30,000) / 50,000 = 40%
- Net Profit Margin = Net Income / Revenue
- Kathmandu Retail: 3,000 / 50,000 = 6%
Leverage Ratios (How much debt is used?):
- Debt-to-Equity = Total Debt / Total Equity
- Kathmandu Retail: 35,000 / 35,000 = 1.0 (Moderate risk)
4. Adjusting Entries: Ensuring GAAP Compliance
Why Adjust? Accrual accounting requires revenue/expenses to be matched to the period they occur, not when cash is exchanged.
Types of Adjusting Entries:
| Type | Example | Journal Entry |
|---|---|---|
| Deferrals | Prepaid Rent (expense paid in advance) | Dr: Rent Expense, Cr: Prepaid Rent |
| Accruals | Interest Earned (not yet received) | Dr: Interest Receivable, Cr: Interest Revenue |
| Estimates | Depreciation | Dr: Depreciation Expense, Cr: Accumulated Depreciation |
Worked Example: NTC’s Depreciation
- Cost of Power Plant: NPR 100,000,000
- Useful Life: 20 years
- Annual Depreciation: 100,000,000 / 20 = NPR 5,000,000
| **Date**       | **Particulars**               | **Dr (NPR)** | **Cr (NPR)** |
|----------------|-------------------------------|--------------|--------------|
| 2023-12-31     | Depreciation Expense          | 5,000,000    |              |
| 2023-12-31     | Accumulated Depreciation      |              | 5,000,000    |
5. Financial Planning and Projections
Businesses use historical statements to forecast future performance.
Example: Khalti’s Projected Income Statement (2024)
| **Item**               | **2023 Actual** | **2024 Forecast** | **% Growth** |
|------------------------|-----------------|-------------------|--------------|
| Sales Revenue          | 50,000          | 60,000            | +20%         |
| COGS                   | 30,000          | 36,000            | +20%         |
| Gross Profit           | 20,000          | 24,000            | +20%         |
| Operating Expenses     | 15,000          | 18,000            | +20%         |
| Net Income             | 5,000           | 6,000             | +20%         |
Assumptions:
- Sales growth: +20% (based on digital payment trends).
- COGS growth: +20% (raw material inflation).
- Expenses: +20% (salary hikes).
In the Real World
eSewa’s Cash Flow Statement
- Operating Activities: Cash inflows from transaction fees (NPR 200-500 per payment).
- Investing Activities: Outflows for server upgrades (NPR 50M/year).
- Financing Activities: Loans from financial institutions (NPR 100M in 2022).
- Why it matters: eSewa must ensure operating cash flow > investing outflows to sustain growth.
Ncell’s Depreciation and Balance Sheet
- Non-current asset: Cell towers (NPR 20B).
- Annual depreciation: NPR 2B (10% of cost).
- Impact: Reduces taxable income (saves NPR 500M in taxes annually).
Daraz’s Inventory Turnover Ratio
- COGS: NPR 15B (2023).
- Average Inventory: NPR 5B.
- Turnover Ratio: 15B / 5B = 3 times/year.
- Insight: Daraz sells inventory every 4 months—efficient!
Exam Tip
Memorize Formats:
- Income Statement: Revenue – Expenses = Net Income.
- Balance Sheet: Assets = Liabilities + Equity.
- Cash Flow: Operating + Investing + Financing = Net Change in Cash.
Common Mistakes to Avoid:
- Mixing accrual vs. cash basis: Income Statement ≠ Cash Flow.
- Ignoring adjusting entries: Always check for prepaid, accrued, or depreciation items.
- Ratio miscalculations: Double-check Current Ratio = Current Assets / Current Liabilities.
Exam Strategy:
- Part A (Short Answers): Define Income Statement, Balance Sheet, Cash Flow Statement clearly.
- Part B (Numerical): Show all steps (journal entries → ledger → trial balance → statements).
- Part C (Analysis): Use ratios (liquidity, profitability) and trend analysis for interpretation.
Worked Example Pitfall:
- Never assume numbers. If given NPR 50,000 sales, calculate COGS, expenses, and net income logically.
- Example: If gross profit is 40% of sales, then COGS = 60% of 50,000 = NPR 30,000.
Final Visual Summary:
mindmap
  root((Financial Statements))
    Income Statement
      Revenue
      Expenses
      Net Income
    Balance Sheet
      Assets = Liabilities + Equity
      Current vs. Non-current
    Cash Flow Statement
      Operating
      Investing
      Financing
    Analysis Techniques
      Horizontal Analysis
      Vertical Analysis
      Ratio Analysis
    Adjusting Entries
      Deferrals
      Accruals
      Estimates
Based on the TU BBM syllabus for Basic Finance (FIN211), unit 3.
Discussion
Loading…