Business StatisticsUnit 119 min read
Probability Distributions: Binomial, Poisson & Normal
Unit 11 of Business Statistics explores three key probability distributions—Binomial, Poisson, and Normal—covering their definitions, probability mass functions (PMF)/density functions (PDF), expected values, variances, and real-world applications in business decision-making, risk assessment, and quality control.
TAKEAWAYS:
- Binomial distribution models exactly n independent trials with two outcomes (success/failure) and constant probability p (e.g., pass/fail, yes/no).
- Poisson distribution describes rare events in a fixed interval (e.g., customer arrivals, defects per unit) with λ = mean = variance.
- Normal distribution is bell-shaped, symmetric, and used for continuous data (e.g., heights, exam scores, stock returns) with 68-95-99.7 rule.
- Key formulas:
- Binomial: , , .
- Poisson: , .
- Normal: .
- Applications: Binomial for quality control (defective items), Poisson for call center arrivals, Normal for financial risk modeling.
- Exam focus: Calculate probabilities, find parameters (n, p, λ), and interpret real-world scenarios (e.g., loan defaults, delivery delays).
1. Binomial Distribution: Counting Successes in Fixed Trials
Definition and Key Features
The binomial distribution models the number of successes (X) in n independent trials, where each trial has:
- Two possible outcomes: success (probability p) or failure (probability 1-p).
- Constant p across trials (e.g., coin flips, pass/fail exams).
- Trials are independent (outcome of one does not affect others).
Notation:
- : Binomial with n trials and success probability p.
- PMF: , where .
Worked Example 1: Probability of Defective Items (Binomial)
Scenario: A factory produces light bulbs with a 5% defect rate (p=0.05). If a quality inspector checks 20 bulbs, what is the probability that exactly 2 are defective?
Solution: Here, , and we want .
Real-World Tie-In:
- Daraz Quality Control: Daraz uses binomial distribution to estimate the probability of defective orders in a batch of 1000 items with a 2% defect rate. For example, helps decide whether to reject a shipment.
2. Poisson Distribution: Modeling Rare Events
Definition and Key Features
The Poisson distribution models the number of rare events occurring in a fixed interval (time/space) with:
- Constant mean rate λ (e.g., arrivals per hour, defects per km).
- Events occur independently.
- Mean = Variance = λ.
Notation:
- .
- PMF: .
Worked Example 2: Call Center Arrivals (Poisson)
Scenario: A call center receives an average of 3 calls per minute (λ=3). What is the probability of exactly 5 calls in the next minute?
Solution:
Real-World Tie-In:
- Pathao Ride Requests: Pathao uses Poisson distribution to predict the number of ride requests per hour in a zone. If λ=10 requests/hour, helps allocate drivers dynamically.
- NTC Power Outages: NTC tracks outages per district using Poisson to plan maintenance (e.g., λ=0.5 outages/day in Kathmandu).
3. Normal Distribution: The Bell Curve
Definition and Key Features
The normal distribution is a continuous distribution:
- Bell-shaped, symmetric about the mean (μ).
- 68-95-99.7 Rule:
- 68% of data within μ ± σ.
- 95% within μ ± 2σ.
- 99.7% within μ ± 3σ.
- PDF: .
Standard Normal (Z-Score): Convert any normal to using:
Worked Example 3: Loan Approvals (Normal)
Scenario: Bank loans have mean μ=500,000 Rs and standard deviation σ=50,000 Rs. What percentage of loans are between 450,000 Rs and 550,000 Rs?
Solution: Convert to Z-scores: From Z-table:
Real-World Tie-In:
- Nepal Rastra Bank (NRB) Interest Rates: NRB assumes loan defaults follow a normal distribution to set risk reserves. For example, if μ=3% default rate and σ=0.5%, estimates high-risk scenarios.
- NEPSE Stock Returns: Stock analysts use normal distribution to model daily returns (e.g., μ=0.2%, σ=1.5%) and calculate probabilities of gains/losses.
4. Comparing the Three Distributions
| Feature | Binomial | Poisson | Normal |
|---|---|---|---|
| Type | Discrete | Discrete | Continuous |
| Use Case | Fixed trials, two outcomes | Rare events in fixed interval | Continuous data (heights, scores) |
| Parameters | n (trials), p (probability) | λ (mean rate) | μ (mean), σ (std dev) |
| Mean | |||
| Variance | |||
| Example | Number of heads in 10 coin flips | Number of typos per page (λ=2) | Heights of Nepali adults (μ=165cm) |
5. When to Use Which Distribution?
flowchart TD
    A["Start"] --> B{"Is data discrete or continuous?"}
    B -->|"Discrete"| C{"Are there fixed trials with two outcomes?"}
    C -->|"Yes"| D["Use Binomial"]
    C -->|"No"| E{"Are events rare and independent?"}
    E -->|"Yes"| F["Use Poisson"]
    E -->|"No"| G["Use other discrete distributions"]
    B -->|"Continuous"| H{"Is data symmetric and bell-shaped?"}
    H -->|"Yes"| I["Use Normal"]
    H -->|"No"| J["Use other continuous distributions"]
Key Rules of Thumb:
- Binomial: Use when you have yes/no outcomes in fixed trials (e.g., pass/fail, defective/non-defective).
- Poisson: Use for counts of rare events (e.g., accidents, customer complaints).
- Normal: Use for continuous data (e.g., heights, test scores, stock prices).
6. Relationships Between Distributions
Poisson Approximates Binomial: If is large and is small (e.g., , ), then . Example: .
Normal Approximates Binomial: If is large (e.g., ), then . Example: .
Poisson Approximates Normal: If is large (e.g., ), then . Example: .
7. Solving Past Exam Questions
Question 1: Binomial Probability (TU 2078)
A bag contains 20 balls numbered 1 to 20. A ball is drawn at random without replacement. What is the probability that the number is a multiple of 3 or 7?
Solution:
- Total balls: 20.
- Multiples of 3: 3, 6, 9, 12, 15, 18 → 6 balls.
- Multiples of 7: 7, 14 → 2 balls.
- Multiples of both (21): None (since max is 20).
- Probability: .
Note: This is not binomial because it’s without replacement (hypergeometric distribution). For binomial, trials must be independent and with replacement.
Question 2: Poisson PMF (TU 2077)
Find for a Poisson distribution with .
Solution:
In the Real World
Khalti Transaction Failures:
- Khalti models failed transactions as a Poisson process with failures per 100 transactions. For 500 transactions, helps estimate refunds.
Ncell Customer Complaints:
- Ncell tracks complaints per day using Poisson with . triggers extra customer support staff.
Daraz Delivery Delays:
- Daraz assumes delivery delays follow a normal distribution with days and days. estimates late penalties.
Exam Tip
Identify the Distribution:
- Discrete + fixed trials + two outcomes → Binomial.
- Discrete + rare events → Poisson.
- Continuous + symmetric → Normal.
Memorize Key Formulas:
- Binomial PMF: .
- Poisson PMF: .
- Normal Z-score: .
Practice Z-Table Lookups:
- Always convert to standard normal () for normal distribution problems.
Watch for Tricks:
- Without replacement → Not binomial (use hypergeometric).
- Large n, small p → Poisson approximation.
- Large n → Normal approximation.
Real-World Scenarios:
- Binomial: Quality control (defective items), pass rates.
- Poisson: Customer arrivals, machine failures.
- Normal: Heights, exam scores, financial returns.
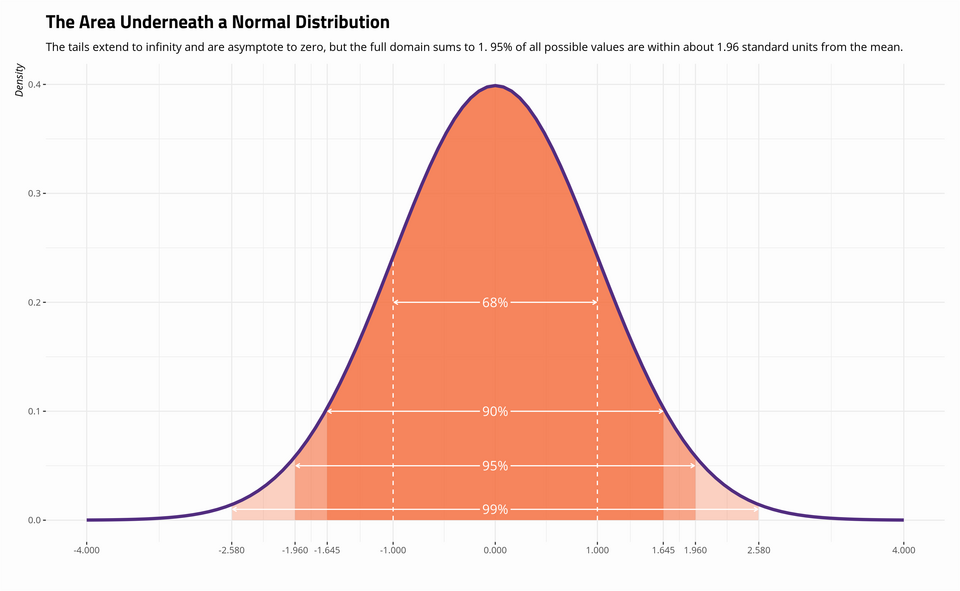 Standard normal distribution (μ=0, σ=1) with shaded 68% area (Image: ssindhwani, CC BY-SA 4.0, via Wikimedia Commons)
Based on the TU BBM syllabus for Business Statistics (STT201), unit 11.
Discussion
Loading…