Fundamentals Of FinanceUnit 712 min read
Capital Budgeting & Cost of Capital: Techniques, Decisions & Real-World Use
Unit 7 of Fundamentals Of Finance covers capital budgeting techniques (NPV, IRR, PI), cost of capital calculation (WACC, after-tax cost of debt), capital structure optimization, and how these tools guide long-term financial decisions in Nepali businesses like banks and manufacturing firms.
TAKEAWAYS:
- Capital budgeting evaluates long-term projects using NPV, IRR, and PI—only accept projects where NPV > 0 and IRR > cost of capital.
- The weighted average cost of capital (WACC) blends debt, equity, and preferred stock costs to measure a company’s minimum required return.
- Cost of debt is always calculated after-tax because interest payments are tax-deductible (e.g., a 10% pre-tax debt becomes 7% after 30% tax).
- Optimal capital structure balances risk and return—too much debt increases financial risk, while too little equity limits growth.
- Real-world tie: Banks like NMB use IRR to decide whether to fund a new branch, while Daraz uses NPV to evaluate warehouse expansions.
1. What is Capital Budgeting?
Capital budgeting is the process of planning, evaluating, and selecting long-term investment projects (e.g., buying machinery, expanding a factory, or launching a new product line). Unlike working capital (short-term funds), these decisions lock money for years—so mistakes are costly.
Why is it critical?
- High stakes: A wrong decision (e.g., investing in outdated tech) can bankrupt a company.
- Cash flow focus: Profit ≠ cash flow. A project may show profit but drain cash (e.g., a slow-selling product).
- Risk vs. return: Higher returns often mean higher risk (e.g., a new tech startup vs. a government bond).
2. Key Capital Budgeting Techniques
Three methods dominate exams and real-world use:
| Method | Formula | Decision Rule | Strengths | Weaknesses |
|---|---|---|---|---|
| NPV (Net Present Value) | Accept if NPV > 0 | Considers time value of money, accounts for all cash flows. | Requires a discount rate (WACC). | |
| IRR (Internal Rate of Return) | Solve for where | Accept if IRR > WACC | Shows return as a percentage, easy to compare with cost of capital. | May give multiple IRRs for unconventional cash flows. |
| PI (Profitability Index) | Accept if PI > 1 | Ranks projects by bang-for-buck, useful when capital is limited. | Ignores project size (favors small projects). |
A visual side-by-side of NPV, IRR, and PI with pros/cons.
3. Worked Example: Should Kathmandu’s Retail Shop Expand?
Scenario: Kathmandu Retail (a mid-sized shop in Thapathali) wants to invest NPR 5,000,000 in a new automated checkout system. The system will:
- Save NPR 1,200,000/year in labor costs (5 years).
- Require NPR 300,000/year for maintenance.
- Have a salvage value of NPR 500,000 after 5 years.
- The company’s WACC is 12%.
Step 1: Calculate Annual Cash Flows
Step 2: Compute NPV
Using the formula: Decision: Since NPV > 0, accept the project.
Step 3: Calculate IRR
Using a financial calculator or Excel (=IRR([-5M, 900K, 900K, 900K, 900K, 1.2M])):
Decision: Accept (IRR > WACC).
4. Cost of Capital: The Hurdle Rate
The cost of capital is the minimum return a project must earn to justify using the company’s funds. It’s calculated as the WACC (Weighted Average Cost of Capital).
How to Calculate WACC
Where:
- = Market value of equity
- = Market value of debt
- = Market value of preferred stock
- (Total capital)
- = Cost of equity (use CAPM: )
- = Cost of debt (after-tax)
- = Cost of preferred stock
- = Tax rate
A labeled diagram showing the WACC formula with arrows to each component (equity, debt, preferred stock).
Why After-Tax Cost of Debt?
Example: Nepal Bank Ltd borrows at 10% pre-tax. With a 30% tax rate: Why?
- Interest is a tax-deductible expense, reducing taxable income.
- Ignoring this overstates the true cost of debt.
5. Capital Structure: The Debt-Equity Mix
A company’s capital structure is how it finances operations—debt vs. equity. The optimal structure balances:
- Cheaper debt (tax shield) vs. higher risk (bankruptcy if cash flows drop).
- Equity is expensive (dividends, shareholder expectations) but flexible.
Modigliani-Miller (MM) Theory
- Proposition I: In a perfect world, a company’s value does not depend on capital structure (only on its cash flows).
- Proposition II: The cost of equity rises with more debt (investors demand higher returns for risk).
- Reality: Taxes and bankruptcy costs make some debt optimal.
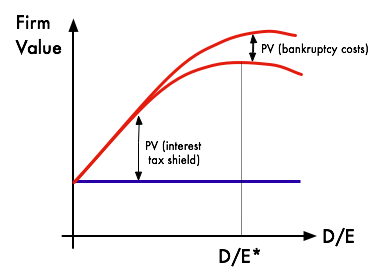 Capital structure trade-off (Image: Suicup, CC BY-SA 3.0, via Wikimedia Commons)
*A graph showing:
Capital structure trade-off (Image: Suicup, CC BY-SA 3.0, via Wikimedia Commons)
*A graph showing:
- Left (too little debt): Low tax benefits, high cost of equity → Low value.
- Middle (optimal): Balanced tax shield and risk → Highest value.
- Right (too much debt): High bankruptcy risk → Low value.*
Real-World Example: NMB Bank’s Capital Structure
| Source | NMB’s % | Cost | After-Tax Cost |
|---|---|---|---|
| Debt | 40% | 8% | 5.6% (after 30% tax) |
| Preferred Stock | 10% | 9% | 9% (no tax shield) |
| Equity | 50% | 14% (CAPM) | 14% |
| WACC | 9.8% |
Decision: NMB uses 40% debt because:
- Debt is cheaper than equity.
- The tax shield offsets the higher cost of equity.
6. In the Real World
1. eSewa’s Mobile Top-Up System (NPV & IRR)
- How it uses capital budgeting: eSewa evaluates whether to expand its QR-based payment network in rural areas.
- Example: To add 50 new villages, eSewa needs NPR 20M. The project generates NPR 5M/year in transaction fees for 4 years.
- NPV Calculation (WACC = 15%): Result: Accept (NPV > 0). eSewa expanded to 1,200+ villages using this logic.
2. Daraz’s Warehouse Expansion (PI Ranking)
- How it uses capital budgeting: Daraz ranks warehouse projects by Profitability Index (PI) when capital is limited.
- Example: Two projects:
- Project A: NPR 10M investment, PV of CFs = NPR 12M → PI = 1.2
- Project B: NPR 5M investment, PV of CFs = NPR 5.5M → PI = 1.1
- Decision: Daraz picks Project A (higher PI) even though it costs more, because it generates more value per rupee.
3. Ncell’s 5G Rollout (IRR vs. WACC)
- How it uses capital budgeting: Ncell compares the IRR of 5G infrastructure to its WACC (14%).
- Example: 5G project costs NPR 8B and has an IRR of 16%.
- Decision: Accept (16% > 14%). Ncell’s 5G expansion was approved based on this.
7. Common Mistakes in Capital Budgeting
| Mistake | Why It’s Wrong | Fix |
|---|---|---|
| Ignoring time value of money | Treating future cash flows as equal to today’s. | Always discount cash flows. |
| Using accounting profit instead of cash flow | Depreciation is non-cash; focus on real cash. | Use free cash flows (FCF). |
| Overestimating project lifespan | Assuming a project lasts forever. | Use realistic horizons (e.g., 5–10 years). |
| Ignoring inflation | Assuming 10% return in a 7% inflation world. | Adjust discount rates for inflation. |
| Mutually exclusive projects without comparing NPV | Picking the "higher IRR" blindly. | Compare NPV per rupee invested. |
8. Exam Tip: How to Score Full Marks
Always show calculations:
- For NPV/IRR, write the formula and plug in numbers.
- For WACC, label each component (debt, equity, tax rate).
Compare methods:
- If NPV and IRR give different decisions, explain why (e.g., multiple IRRs or mutually exclusive projects).
Real-world tie-ins:
- Link answers to Nepali companies (e.g., "Like NMB Bank, a company should use after-tax cost of debt...").
Watch for traps:
- Question: "Why is cost of debt after-tax?" Answer: "Because interest is tax-deductible, reducing the net cost to the firm."
- Question: "Which method is best?" Answer: "NPV is theoretically superior, but IRR is simpler for standalone projects."
Diagrams save marks:
- Draw a T-account for cost of capital components.
- Use a mermaid flowchart for the capital budgeting process (see below).
9. Quick Revision Table
| Concept | Key Idea | Formula/Example |
|---|---|---|
| NPV | Present value of cash flows minus cost. | |
| IRR | Discount rate where NPV = 0. | Solve |
| WACC | Blended cost of all capital sources. | |
| Cost of Debt | After-tax interest rate. | |
| Optimal Capital Structure | Balances tax benefits and risk. | Debt increases value until bankruptcy risk outweighs tax shield. |
10. Final Worked Example: Shalimar Paints (Exam-Style)
Given:
- Capital Structure: Debt (30%), Preferred Stock (15%), Equity (55%).
- Tax Rate: 30%.
- Costs:
- Debt: 10% (pre-tax).
- Preferred Stock: 9% dividend.
- Equity: (from CAPM).
- Market Values: , , .
Calculate WACC:
- After-tax cost of debt:
- WACC: Decision: Shalimar Paints should only accept projects with IRR > 10.15%.
*A pie chart showing:
- Equity (55% at 12%)
- Debt (30% at 7% after-tax)
- Preferred Stock (15% at 9%) with a label "WACC = 10.15%".*
Based on the TU BBM syllabus for Fundamentals Of Finance (FIN206), unit 7.
Discussion
Loading…