Business Research MethodsUnit 712 min read
Sampling Techniques: Types, Methods & Applications
Unit 7 of Business Research Methods explores sampling techniques—how researchers select representative subsets from populations, covering probability vs. non-probability methods, sampling errors, and real-world applications in Nepali businesses like Ncell surveys or Daraz customer feedback systems.
TAKEAWAYS:
- Sampling reduces costs/time by studying a subset instead of the entire population, but must ensure representativeness to avoid bias.
- Probability sampling (random, systematic, stratified, cluster) guarantees statistical validity, while non-probability sampling (convenience, purposive, snowball) is faster but less generalizable.
- Sampling error (difference between sample stats and population parameters) can be minimized by increasing sample size or using stratified methods.
- Real-world tie: Ncell uses stratified sampling to survey customers across age groups, while Daraz relies on convenience sampling for quick feedback from active users.
- Exam focus: Classify sampling types, compare methods in tables, and justify choices for hypothetical research (e.g., "How would you sample for a study on Kathmandu traffic congestion?").
1. What Is Sampling?
Sampling is the process of selecting a subset (sample) from a larger group (population) to study, analyze, or make inferences about the whole. It is essential in business research to:
- Save time and money (e.g., surveying 500 Daraz customers instead of all 5 million).
- Ensure practicality (e.g., NTC cannot test every vehicle’s fuel efficiency).
- Maintain representativeness (the sample must reflect the population’s key traits).
Worked Example: Kathmandu Traffic Study Population: All vehicles in Kathmandu. Sample: 1,000 vehicles selected via systematic sampling (every 100th vehicle at checkpoints). Why? Random stops would miss rush-hour patterns; systematic sampling covers peak times uniformly.
2. Probability vs. Non-Probability Sampling
| Feature | Probability Sampling | Non-Probability Sampling |
|---|---|---|
| Selection Method | Random; every unit has a known chance of selection. | Non-random; researcher’s judgment or convenience. |
| Representativeness | High (generalizable to population). | Low (biased; not generalizable). |
| Sampling Error | Can be calculated and minimized. | Cannot be quantified. |
| Cost/Time | Higher (requires lists/frames). | Lower (quick and easy). |
| Example in Nepal | Ncell’s random-digit-dialing surveys. | Daraz’s feedback from recent buyers (convenience). |
mindmap
root((Sampling Techniques))
Probability Sampling
Simple Random
Systematic
Stratified
Cluster
Non-Probability Sampling
Convenience
Purposive
Snowball
Quota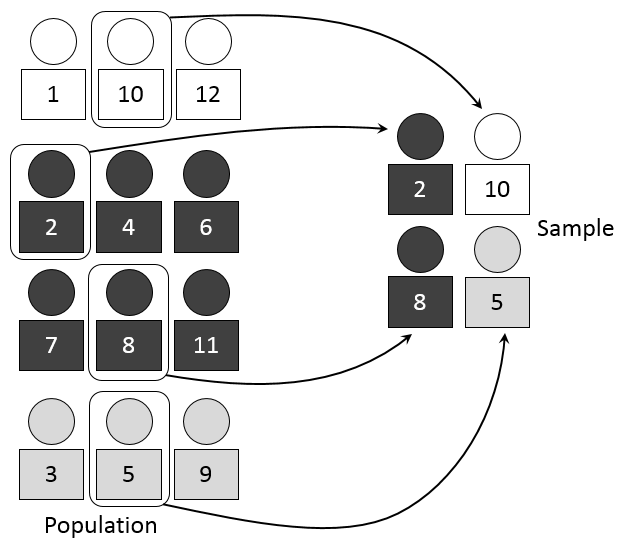 Stratified sampling divides the population into homogeneous subgroups (strata) before random selection. (Image: Dan Kernler, CC BY-SA 4.0, via Wikimedia Commons)
3. Probability Sampling Techniques
A. Simple Random Sampling
- Every member of the population has an equal chance of being selected.
- Method: Use random number tables or software (e.g., Excel’s
RAND()). - Example: NEPSE selects 100 random listed companies to analyze stock trends.
- Advantages:
- Unbiased, easy to analyze statistically.
- No need for population stratification.
- Disadvantages:
- Requires a complete sampling frame (e.g., Ncell needs all customer phone numbers).
- May miss subgroups (e.g., rural vs. urban users).
Worked Example: Nabil Bank Loan Study Population: All 50,000 loan applicants in 2023. Sample: 500 selected via random number generator. Analysis: 95% confidence interval for default rates = 8% ± 3%.
B. Systematic Sampling
- Selects every k-th member from a list after a random start.
- Formula:
- Example: NTC inspects every 50th vehicle exiting Kathmandu for emissions.
- Advantages:
- Simpler than random sampling.
- Ensures even coverage (e.g., Daraz surveys every 100th order).
- Disadvantages:
- Periodicity bias: If the population has hidden patterns (e.g., vehicles sorted by engine size), results may skew.
Worked Example: Pathao Driver Survey Population: 20,000 drivers. Sample: 200 drivers selected via (start at driver #42, then #142, #242, etc.). Risk: If drivers are listed by region, urban drivers may dominate.
C. Stratified Sampling
- Divides the population into homogeneous subgroups (strata) and samples from each.
- Proportional allocation: Sample size per stratum = .
- Example: Khalti surveys strata by age (18–30, 31–45, 46+) to ensure all groups are represented.
- Advantages:
- More precise estimates for subgroups.
- Reduces sampling error for heterogeneous populations.
- Disadvantages:
- Requires prior knowledge of strata (e.g., income levels for a bank study).
Worked Example: eSewa User Study Population: 5 million users. Strata:
- Urban (60%), Rural (30%), Suburban (10%). Sample: 600 urban, 300 rural, 100 suburban users. Why? Rural users may have different payment habits (e.g., lower mobile money usage).
D. Cluster Sampling
- Divides the population into heterogeneous clusters, randomly selects clusters, and samples all members within them.
- Example: NTC tests 5 random districts and surveys all vehicles in those districts.
- Advantages:
- Cost-effective (no need for full population list).
- Useful for geographically dispersed populations (e.g., Daraz sellers across Nepal).
- Disadvantages:
- Higher sampling error if clusters are not representative.
Worked Example: Himalayan Java Tea Farmer Survey Population: 10,000 tea farmers in 50 districts. Clusters: Randomly select 5 districts → survey all 200 farmers in those districts. Risk: If selected districts are all high-altitude, results may not apply to terai farmers.
4. Non-Probability Sampling Techniques
A. Convenience Sampling
- Selects the easiest accessible members.
- Example: Daraz asks recent buyers (who already visited the site) for feedback.
- Advantages:
- Fast and cheap.
- Useful for pilot studies (e.g., testing a new Ncell app feature).
- Disadvantages:
- Highly biased (e.g., only tech-savvy users respond to eSewa surveys).
Worked Example: Kathmandu University Café Study Population: All students. Sample: 50 students already sitting in the café at 3 PM. Bias: Excludes night-shift students or those who study elsewhere.
B. Purposive Sampling
- Researcher intentionally selects members based on specific criteria.
- Example: Nabil Bank studies 5 high-risk loan defaulters to understand patterns.
- Advantages:
- Deep insights into rare cases (e.g., fraud in Khalti transactions).
- Disadvantages:
- Not generalizable (cannot apply findings to all customers).
C. Snowball Sampling
- Initial subjects refer others who fit the criteria.
- Example: Studying undocumented migrant workers in Nepal (hard to locate directly).
- Advantages:
- Useful for hidden populations.
- Disadvantages:
- Referral bias (friends may share similar traits).
D. Quota Sampling
- Divides the population into strata and fills quotas via convenience.
- Example: A market research firm for Coca-Cola in Nepal needs 200 males, 200 females, 100 under 25, 100 over 50—selected via street interviews.
- Advantages:
- Ensures proportional representation without random selection.
- Disadvantages:
- Researcher bias in selecting quota members.
5. Sampling Error and How to Minimize It
Sampling error = Difference between sample statistic (e.g., mean income) and population parameter. Factors affecting error:
- Sample size: Larger samples reduce error (e.g., Ncell’s 1,000 vs. 100 surveys).
- Sampling method: Probability methods (e.g., stratified) yield lower error than convenience sampling.
- Population homogeneity: More variation → larger required sample.
Formula for Sample Size (Simple Random Sampling):
- = Population size
- = Z-score (1.96 for 95% confidence)
- = Expected proportion (e.g., 0.5 for maximum variability)
- = Margin of error (e.g., 5% = 0.05)
Worked Example: NEPSE Stock Index Study Population: 150 listed companies. Desired margin of error: 4%. Sample size:
6. Real-World Applications in Nepal
Case Study 1: Ncell Customer Satisfaction Survey
- Method: Stratified random sampling (urban/rural, age groups).
- Why? Ncell needs to tailor services (e.g., rural data packs vs. urban 5G).
- Outcome: Identified that 60% of rural users prefer cash recharge, leading to more agent outlets in villages.
Case Study 2: Daraz Order Fulfillment Study
- Method: Convenience sampling (surveying customers who just placed orders).
- Risk: Biases toward repeat buyers (not first-time users).
- Fix: Combined with purposive sampling of 50 first-time buyers for deeper insights.
Case Study 3: NTC Vehicle Emission Test
- Method: Systematic sampling (every 20th vehicle at checkpoints).
- Challenge: Periodicity bias if vehicles are sorted by age (older vehicles may cluster).
- Solution: Randomize checkpoint times (morning vs. evening).
7. Ethical Considerations in Sampling
- Informed consent: Participants must know they’re part of a study (e.g., Khalti’s survey pop-ups).
- Avoiding coercion: No pressure to respond (e.g., Daraz shouldn’t offer discounts for feedback).
- Anonymity: Ensure data is confidential (e.g., Nabil Bank’s loan defaulter study).
- Bias mitigation: Disclose sampling methods to interpret results correctly.
Exam Tip
Classification Questions:
- Draw a mindmap (like above) or table to classify sampling techniques.
- Example answer for "Explain the classification of sampling technique":
Sampling techniques are divided into probability (random, systematic, stratified, cluster) and non-probability (convenience, purposive, snowball, quota) methods. Probability methods ensure generalizability via random selection, while non-probability methods are faster but biased.
Justify Your Choice:
- For hypothetical studies (e.g., "How would you sample for a study on student stress at TU?"), explain:
- Method: Stratified sampling (by faculty: Management, Engineering, etc.).
- Why? Ensures each faculty’s unique stress factors (e.g., exam pressure vs. project workload) are represented.
- Sample size: 300 students (10% of population) for 95% confidence.
- For hypothetical studies (e.g., "How would you sample for a study on student stress at TU?"), explain:
Calculate Sample Size:
- Memorize the sample size formula and apply it to exam questions (e.g., "Calculate the sample size for a population of 5,000 with a 3% margin of error").
Real-World Links:
- Connect sampling to Nepali businesses:
- Ncell: Uses stratified sampling for regional coverage.
- Daraz: Uses convenience sampling for quick feedback but supplements with purposive sampling for edge cases.
- NTC: Uses systematic sampling for vehicle checks.
- Connect sampling to Nepali businesses:
Avoid Common Mistakes:
- ❌ Saying "random sampling is always best" (ignore cost/time constraints).
- ❌ Confusing stratified (subgroups sampled separately) with cluster (whole clusters sampled).
- ❌ Ignoring sampling error in non-probability methods.
flowchart TD
    A["Research Question"] --> B{"Probability or Non-Probability?"}
    B -->|"Probability"| C["Simple Random<br/>Systematic<br/>Stratified<br/>Cluster"]
    B -->|"Non-Probability"| D["Convenience<br/>Purposive<br/>Snowball<br/>Quota"]
    C --> E["Ensures Generalizability<br/>Higher Cost"]
    D --> F["Faster<br/>Biased<br/>Lower Cost"]
    E --> G["Analyze Statistically"]
    F --> H["Qualitative Insights"]
    G --> I["Report Findings"]
    H --> I
Based on the TU BBM syllabus for Business Research Methods (RCH311), unit 7.
Discussion
Loading…