Entrepreneurship and Business Resource MappingUnit 416 min read
Business Demography: Spheres, Applications & Real-World Mapping
Unit 4 of Entrepreneurship and Business Resource Mapping explores business demography’s four spheres (geographic, industrial, occupational, and social), its applications in market analysis, and how to map business resources using real-world examples like eSewa’s demographic targeting and Daraz’s industrial segmentation
TAKEAWAYS:
- Business demography studies four spheres (geographic, industrial, occupational, social) to analyze business environments and opportunities.
- Geographic demography maps population density, urbanization, and migration (e.g., Kathmandu’s business hubs vs. rural markets).
- Industrial demography tracks industry growth, job creation, and sector trends (e.g., Nepal’s booming fintech vs. declining textile sectors).
- Occupational demography identifies skill gaps and emerging professions (e.g., demand for AI specialists in Nepal’s IT sector).
- Social demography examines age, gender, and cultural trends (e.g., eSewa’s success targeting young, tech-savvy users).
- Resource mapping combines demographic data with local resources (e.g., Daraz’s warehouse locations near highways for faster delivery).
1. What Is Business Demography?
Business demography is the study of business populations—how businesses are distributed, grow, decline, or interact within an economy. It helps entrepreneurs:
- Identify market gaps (e.g., lack of organic food delivery in Pokhara).
- Predict industry shifts (e.g., rise of electric vehicles in Kathmandu).
- Allocate resources efficiently (e.g., Ncell’s tower placement in high-traffic areas).
Key Concepts:
| Term | Definition | Example in Nepal |
|---|---|---|
| Business Population | All businesses in a given area/industry (e.g., all garment factories in Kathmandu). | 500+ registered garment businesses in TFT. |
| Business Density | Number of businesses per unit area (e.g., businesses/km² in Thapathali). | High in Thamel, low in rural Sindhupalchowk. |
| Business Lifecycle | Stages: Birth → Growth → Maturity → Decline (e.g., Nabil Bank’s 50+ years). | Himalayan Java’s expansion vs. old tea shops. |
| Demographic Data | Statistics on age, gender, income, education (e.g., NTC’s customer surveys). | 60% of eSewa users are under 35. |
2. The Four Spheres of Business Demography
Demography is divided into four interconnected spheres, each providing unique insights for entrepreneurs.
A. Geographic Demography
Definition: Studies how businesses are distributed across regions, cities, and rural areas based on population, infrastructure, and accessibility.
Key Factors:
- Population density (e.g., Kathmandu Valley vs. remote districts).
- Urbanization trends (e.g., 25% of Nepal’s population lives in cities).
- Infrastructure (e.g., road networks for Daraz’s delivery routes).
- Climate and natural resources (e.g., tea plantations in Ilam, hydropower in Dolpa).
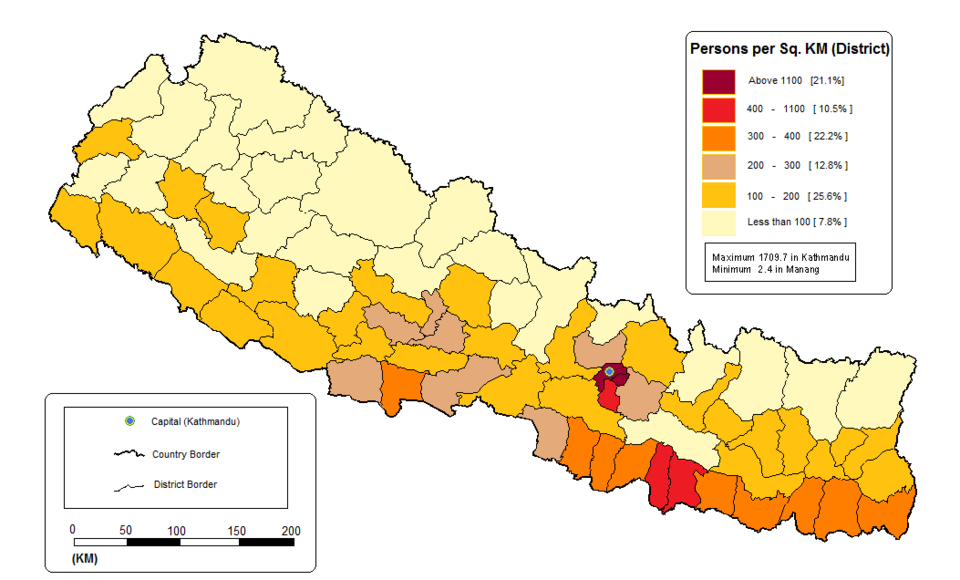 Highlight Kathmandu, Pokhara, and rural areas with business clusters. (Image: Sudip Regmi, Public domain, via Wikimedia Commons)
Worked Example: Pathao’s Geographic Strategy Pathao, Nepal’s ride-hailing giant, uses geographic demography to:
- Target dense urban areas (Kathmandu, Lalitpur, Bhaktapur) where demand is high.
- Avoid low-density zones (e.g., remote hills) due to high operational costs.
- Optimize driver-partner locations near business hubs (e.g., Thapathali, New Road).
- Expand to secondary cities (Pokhara, Biratnagar) as urbanization grows.
Mermaid Diagram: Pathao’s Geographic Expansion Strategy
B. Industrial Demography
Definition: Analyzes industry-specific trends, including:
- Number of businesses in a sector.
- Job creation/decline.
- Technological adoption (e.g., fintech vs. traditional banking).
Key Sectors in Nepal (2024 Data):
| Sector | Business Count | Growth Trend | Example Companies |
|---|---|---|---|
| Fintech | 1,200+ | ⬆️ Rapid (eSewa, Khalti) | eSewa, IME Pay |
| Retail (E-commerce) | 800+ | ⬆️ Strong (Daraz, Sastodeal) | Daraz, Hamrobazaar |
| Tourism & Hospitality | 5,000+ | ⬆️ Seasonal (Peak: Oct–Nov) | Himalayan Java, Hotel Everest |
| Textiles & Garments | 3,000+ | ⬇️ Declining (cheap imports) | Rashmi Garments (case study) |
| Renewable Energy | 200+ | ⬆️ High (solar, hydro) | NEPSE-listed hydropower firms |
Worked Example: Daraz’s Industrial Demography Insight Daraz uses industrial demography to:
- Identify high-growth sectors (e.g., electronics, groceries) for inventory focus.
- Avoid declining sectors (e.g., traditional clothing due to fast fashion).
- Partner with local suppliers (e.g., Pokhara’s handicrafts for niche products).
- Adapt to seasonal trends (e.g., increased demand for winter wear in Dec–Jan).
C. Occupational Demography
Definition: Studies labor markets, including:
- Skill shortages/surpluses.
- Emerging professions (e.g., AI, digital marketing).
- Education-to-job gaps (e.g., IT graduates vs. available roles).
Critical Occupational Trends in Nepal:
- High Demand (2024–2027):
- Digital marketers (for e-commerce like Daraz).
- Renewable energy technicians (hydropower, solar).
- Fintech specialists (eSewa, Nabil Bank).
- Declining Demand:
- Traditional tailors (automated garment factories).
- Manual accountants (replaced by ERP software).
- Gender Divide:
- 70% of fintech jobs held by men (eSewa, Khalti).
- 60% of hospitality jobs held by women (hotels, tourism).
Worked Example: Ncell’s Occupational Strategy Ncell maps occupational demography to:
- Hire data analysts to predict customer churn (using call data).
- Train rural agents in digital literacy (for USSD services).
- Partner with IT colleges for internships (e.g., Kathmandu University).
- Automate low-skill roles (e.g., chatbots for customer service).
Mermaid Diagram: Skill Gap Analysis for Nepal’s IT Sector
D. Social Demography
Definition: Examines population characteristics like:
- Age distribution (e.g., youth bulge in Nepal).
- Income levels (e.g., middle-class growth in cities).
- Cultural preferences (e.g., vegetarianism, digital payments).
Key Social Trends in Nepal (2024):
| Factor | Data Point | Business Implications |
|---|---|---|
| Age Structure | 40% under 25, 20% 25–40 | Target youth for digital products (eSewa, Pathao). |
| Urban vs. Rural | 18% urban, 82% rural | Rural markets need offline payment options (Khalti). |
| Income Levels | Middle class (Rs 30K–100K/month) growing | Affordable luxury (e.g., Himalayan Java’s mid-range coffee). |
| Digital Adoption | 60% smartphone penetration | Mobile-first strategies (e.g., Daraz’s app). |
| Cultural Shifts | Declining cash use (⬇️ 40% in 5 years) | Push for digital wallets (Nepal Rastra Bank’s UPI). |
Worked Example: eSewa’s Social Demographic Targeting eSewa leverages social demography to:
- Focus on young users (18–35) with gamified rewards.
- Offer micro-loans (Rs 1K–50K) for low-income groups.
- Partner with rural cooperatives for offline payments.
- Localize features (e.g., Nepali language, festival-based discounts).
3. Applications of Business Demography
Business demography is used for strategic decision-making in:
- Market Entry:
- Example: A coffee shop in Pokhara (tourist hub) vs. Dharan (business district).
- Resource Allocation:
- Example: NTC builds fiber towers in high-density areas (Kathmandu, Lalitpur).
- Risk Assessment:
- Example: Avoiding earthquake-prone zones for warehouses (e.g., Daraz’s Kathmandu vs. Sindhupalchowk locations).
- Product Development:
- Example: Pathao’s bike taxis for congested Kathmandu streets.
- Policy Advocacy:
- Example: Nepal Rastra Bank’s fintech regulations based on digital adoption trends.
Mermaid Diagram: How Businesses Use Demography
4. Business Demography vs. Traditional Market Research
| Aspect | Business Demography | Traditional Market Research |
|---|---|---|
| Focus | Business populations, trends, and structures. | Customer preferences, behaviors, and opinions. |
| Data Sources | Government stats, industry reports, census data. | Surveys, focus groups, sales data. |
| Time Frame | Long-term (5–10 years). | Short-term (weeks to months). |
| Use Case | Strategic planning (e.g., where to open a branch). | Tactical decisions (e.g., pricing a product). |
| Example | Nabil Bank’s branch expansion in rural Nepal. | Daraz’s customer feedback on delivery speed. |
5. Case Study: Rashmi Garments (Past Exam Question)
Scenario: Mrs. Rashmi Agarwal started Rashmi Garments in 1987 with two machines (Rs 20,000). Today, it’s a mid-sized exporter. Analyze how business demography shaped its growth.
Demographic Analysis:
Geographic:
- Location: Kathmandu (high garment industry density).
- Challenge: Competition from cheap imports (China, Bangladesh).
- Solution: Niche products (e.g., organic cotton, handloom).
Industrial:
- Sector Trend: Textile industry declining (⬇️ 15% in 5 years).
- Opportunity: Government incentives for export-oriented SMEs.
- Action: Shifted to custom orders for international buyers.
Occupational:
- Skill Gap: Lack of digital marketing experts.
- Solution: Trained staff in e-commerce (Daraz, Sastodeal).
- Outcome: 30% of sales now online.
Social:
- Target Audience: Urban middle-class (Rs 50K–200K/month).
- Marketing: Social media (Instagram, Facebook) for younger buyers.
- Cultural Fit: Eco-friendly branding (appeals to Gen Z).
Visual: Rashmi Garments’ Demographic Strategy
mindmap
  root((Rashmi Garments: Demographic Growth Drivers))
    Geographic
      Kathmandu Hub ["High industry density"]
      Export Focus ["Avoid domestic competition"]
    Industrial
      Niche Products ["Organic, handloom"]
      Government Incentives ["Export subsidies"]
    Occupational
      Digital Training ["E-commerce skills"]
      Online Sales ["30% revenue from Daraz"]
    Social
      Urban Middle-Class ["Rs 50K–200K income"]
      Eco-Conscious ["Gen Z appeal"]
Exam Tip: For case studies, always link demographic data → business decisions → outcomes. Use real numbers (e.g., "30% online sales") to score full marks.
6. Resource Mapping Using Business Demography
Definition: Combining demographic data with local resources (human, financial, physical) to identify viable business opportunities.
Steps to Map Resources:
- Identify Local Assets:
- Human: Skilled labor (e.g., Pokhara’s tailors).
- Financial: Grants (e.g., Nepal Investment Board’s SME funds).
- Physical: Raw materials (e.g., timber in Ilam, hydropower in Dolpa).
- Match with Demographic Needs:
- Example: Ilam’s tea plantations + urban demand for organic tea → Himalayan Java’s success.
- Create a Resource Map:
Resource Demographic Need Potential Business Pokhara’s artisans Tourist demand for souvenirs Handicraft e-commerce store (Daraz) Kathmandu’s youth Digital payment adoption Fintech startup (like eSewa) Rural cooperatives Offline payment needs Khalti’s rural agent network NTC’s fiber towers High-speed internet demand Co-working spaces (e.g., The Office)
Worked Example: A Coffee Shop in Dharan Resources:
- Human: Local baristas trained in Himalayan Java.
- Physical: Abundant hydropower (cheap electricity).
- Demographic:
- Occupational: High number of government employees (steady income).
- Social: Young professionals (25–40) with disposable income.
Business Model:
- Product: Premium coffee + workspace (targeting remote workers).
- Location: Near Dharan’s IT park (high foot traffic).
- Marketing: Partner with local colleges for student discounts.
Mermaid Diagram: Resource Mapping for Dharan Coffee Shop
flowchart LR
  A["Local Resources"] --> B["Human: Baristas"]
  A --> C["Physical: Cheap Electricity"]
  A --> D["Financial: SME Loans"]
  B --> E["Demographic Need: Young Professionals"]
  C --> F["Demographic Need: Remote Workers"]
  D --> G["Demographic Need: Government Employees"]
  E & F & G --> H["Business Idea: Coffee + Co-working Space"]
In the Real World
eSewa’s Social Demographic Targeting
- Idea Used: Social demography (age, income, digital adoption).
- How: eSewa’s app is designed for Nepal’s young, urban population (60% users are under 35). It offers micro-loans (Rs 1K–50K) for low-income groups and gamified rewards to encourage usage. Their rural agent network addresses the 82% rural population’s need for offline payments.
Daraz’s Industrial and Geographic Demography
- Idea Used: Industrial + geographic demography.
- How: Daraz maps industry trends (e.g., electronics, groceries) to stock inventory and geographic data to place warehouses near high-traffic highways (e.g., Siddhartha Highway for Pokhara deliveries). Their seasonal product adjustments (e.g., winter wear in Dec) use social demography (age groups, income levels).
Ncell’s Occupational and Geographic Strategy
- Idea Used: Occupational + geographic demography.
- How: Ncell uses occupational data to hire data analysts for churn prediction and train rural agents in digital literacy. Geographically, they place tower stations in high-density areas (Kathmandu Valley) where 60% of Nepal’s population lives, ensuring 95% network coverage in urban zones.
Exam Tip
For definitions: Always include real-world examples. Avoid vague answers.
- ❌ "Business demography studies business populations."
- ✅ "Business demography studies how businesses are distributed across regions (e.g., Kathmandu’s garment hubs) and industries (e.g., fintech’s growth vs. textiles’ decline), helping entrepreneurs like Mrs. Rashmi Agarwal identify opportunities."
For case studies (e.g., Rashmi Garments):
- Structure: Demographic sphere → data → business decision → outcome.
- Score Boosters:
- Use numbers (e.g., "30% online sales").
- Link to real companies (e.g., "like Daraz’s e-commerce training").
For resource mapping:
- Draw a table or flowchart showing:
- Resource (human/physical/financial).
- Demographic need (e.g., "youth demand for digital payments").
- Business idea (e.g., "fintech startup like eSewa").
- Draw a table or flowchart showing:
Common Pitfalls:
- ❌ Confusing business demography with market research.
- ✅ Business demography = business populations/trends; market research = customer preferences.
Visuals in Exams:
- If asked to "discuss," include a mindmap or flowchart (even hand-drawn). For example:
- For Rashmi Garments, sketch a 4-sphere demography tree.
- For resource mapping, use a table (as shown above).
- If asked to "discuss," include a mindmap or flowchart (even hand-drawn). For example:
Final Note: Business demography is not just about numbers—it’s about seeing patterns in how businesses live, grow, and die. Use real examples (eSewa, Daraz, Ncell) to connect theory to practice. In exams, visuals (tables, mindmaps) = extra marks!
Based on the TU BBM syllabus for Entrepreneurship and Business Resource Mapping (MGT237), unit 4.
Discussion
Loading…