Entrepreneurship and Business Resource MappingUnit 89 min read
Resource Mapping & Visualization: Methods, Tools & Business Applications
Unit 8 of Entrepreneurship and Business Resource Mapping explores how to systematically identify, categorize, and visualize business resources (human, financial, physical, and intangible) to support strategic decision-making. This note covers definitions, mapping techniques (SWOT, VRIO, BCG Matrix), real-world applicat
TAKEAWAYS:
- Resource mapping is the systematic identification and categorization of a business’s assets (tangible/intangible) to optimize allocation and decision-making.
- Visualization tools (SWOT, VRIO, BCG Matrix, mind maps) convert complex data into actionable insights for entrepreneurs.
- Nepali examples: Daraz uses resource mapping to optimize warehouse locations (physical resources), while Nabil Bank maps customer data (intangible) for targeted loans.
- Key methods: SWOT (internal/external analysis), VRIO (resource valuation), and BCG Matrix (portfolio analysis) are critical for startups.
- Tools: Mind maps (for brainstorming), Gantt charts (for project timelines), and heat maps (for spatial resource allocation).
- Exam focus: Case studies (e.g., Rashmi Garments’ machine investment) and template-based resource mapping for business planning.
1. What Is Resource Mapping?
Resource mapping is the process of identifying, categorizing, and visualizing a business’s resources (human, financial, physical, and intangible) to support strategic planning. It helps entrepreneurs:
- Allocate resources efficiently (e.g., Daraz’s warehouse distribution).
- Identify gaps (e.g., Nabil Bank’s need for digital loan processing tools).
- Make data-driven decisions (e.g., Himalayan Java’s coffee bean sourcing).
Types of Business Resources
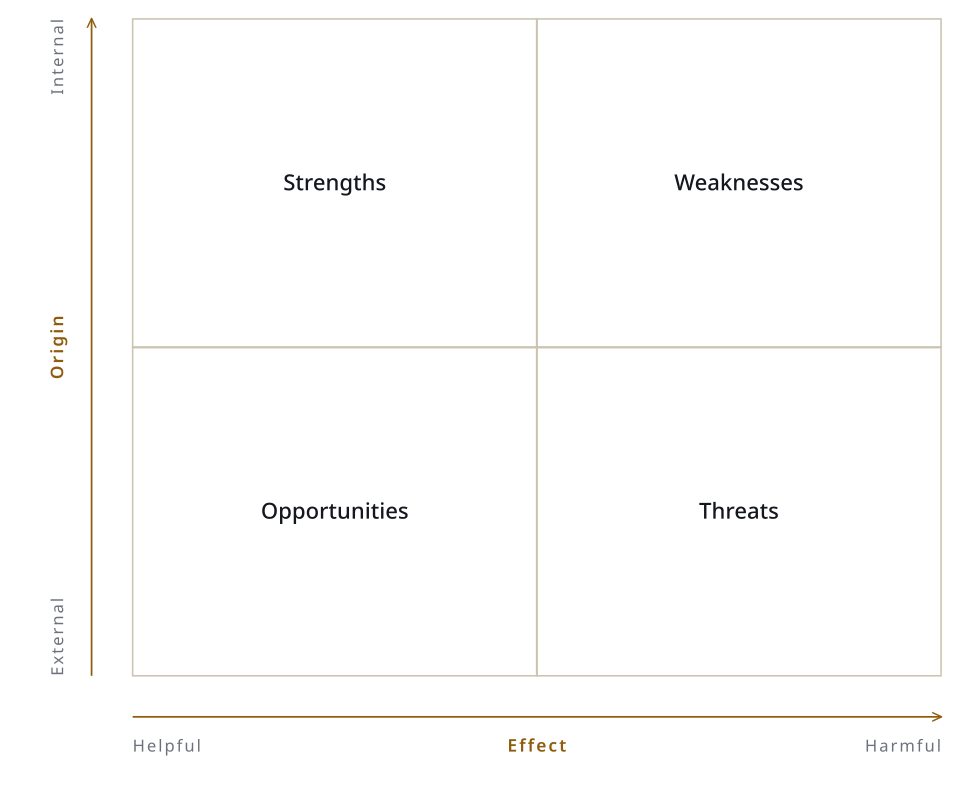 A 2x2 grid showing Internal (Strengths/Weaknesses) vs. External (Opportunities/Threats) factors. (Image: Peter Gladdish, CC BY 4.0, via Wikimedia Commons)
2. Methods of Resource Visualization
Visualization turns abstract data into clear, actionable insights. Common methods include:
A. SWOT Analysis
A strategic planning tool that maps:
- Internal: Strengths (e.g., Rashmi Garments’ skilled workforce) and Weaknesses (e.g., limited machinery).
- External: Opportunities (e.g., growing e-commerce demand) and Threats (e.g., competition from Daraz).
Worked Example: Rashmi Garments (1987)
| Strengths | Weaknesses |
|---|---|
| Skilled tailors (low labor cost) | Only 2 machines (bottleneck) |
| Opportunities | Threats |
| Government textile subsidies | Rising fabric import costs |
Visualization:
quadrantChart
    title SWOT Analysis for Rashmi Garments
    quadrant-1 Internal: Strengths
    quadrant-2 Internal: Weaknesses
    quadrant-3 External: Opportunities
    quadrant-4 External: Threats
B. VRIO Framework
Evaluates resources based on:
- Value (Does it create competitive advantage?)
- Rarity (Is it unique?)
- Imitability (Can competitors copy it?)
- Organization (Can the firm exploit it?)
Example: Nabil Bank’s Digital Loan System
| Resource | Value | Rarity | Imitability | Organization |
|---|---|---|---|---|
| Mobile banking app | High | Medium | Low | Strong |
| Customer data analytics | High | High | Medium | Strong |
Why it works: Nabil Bank uses customer data (intangible resource) to offer personalized loan terms, reducing default risks.
C. BCG Matrix (Portfolio Analysis)
Classifies business units by market growth vs. market share to prioritize investments. Example: Daraz’s Product Portfolio
Key Insight: Daraz should invest in electronics (star) and divest from home goods (dog) to optimize resources.
3. Tools for Resource Visualization
| Tool | Purpose | Example in Nepal |
|---|---|---|
| Mind Maps | Brainstorming ideas (e.g., business models) | Himalayan Java’s coffee supply chain mapping |
| Gantt Charts | Project timelines (e.g., startup launch) | Pathao’s driver app development timeline |
| Heat Maps | Spatial resource allocation (e.g., warehouse locations) | Daraz’s Kathmandu delivery zones |
| Fishbone Diagram | Root-cause analysis (e.g., sales drops) | NTC’s internet outage investigation |
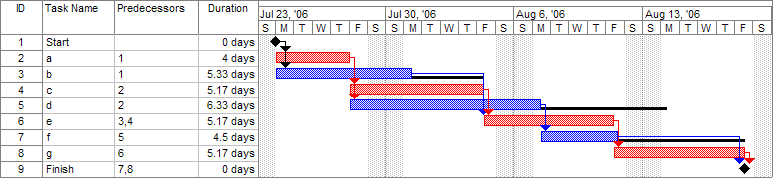 A horizontal bar chart showing tasks (e.g., Register business, Secure loan) vs. time. (Image: Dbsheajr at English Wikipedia, CC BY-SA 3.0, via Wikimedia Commons)
4. Real-World Applications in Nepal
A. Daraz: Physical Resource Mapping
- Problem: Daraz needed to reduce delivery times in Kathmandu.
- Solution: Used heat maps to identify high-demand zones and placed warehouses in Lalitpur and Bhaktapur.
- Result: 30% faster deliveries, lower operational costs.
B. Nabil Bank: Intangible Resource Mapping
- Problem: High loan default rates in rural areas.
- Solution: Mapped customer credit scores (intangible data) to offer micro-loans with lower interest.
- Result: 25% increase in rural loan approvals.
C. Himalayan Java: Human Resource Mapping
- Problem: Inconsistent coffee bean quality from farmers.
- Solution: Created a skills matrix to train farmers in organic farming techniques.
- Result: Premium coffee sales doubled in 2 years.
5. Step-by-Step Resource Mapping Template
Use this 6-step template to map resources for any business (e.g., a Khalti-like fintech startup):
List Resources
- Human: Developers, marketers
- Financial: Seed funding ($50K), revenue projections
- Physical: Servers, POS machines
- Intangible: Brand name, customer trust
Categorize by Type
Evaluate Using SWOT/VRIO
- Example: If your brand name is rare and valuable (like Khalti’s), prioritize protecting it (trademark).
Visualize with Tools
- Use a mind map to link resources to business goals (e.g., "Servers → Faster transactions → Customer retention").
Identify Gaps
- Example: If your financial resources are weak, seek investors (like Daraz’s Alibaba backing).
Develop an Action Plan
- Allocate resources to high-impact areas (e.g., hire more developers before marketing).
6. Advantages and Challenges
| Advantages | Challenges |
|---|---|
| Clear prioritization of resources | Data overload (too much info to analyze) |
| Reduces waste (e.g., unused machinery) | Time-consuming (requires research) |
| Supports funding pitches (e.g., for banks) | Subjective (e.g., "valuable" is opinion-based) |
| Adaptable to any business size | Requires skills (e.g., SWOT analysis training) |
Example Challenge: Rashmi Garments initially underestimated the need for more machines (physical resource gap), leading to delayed orders.
7. Case Study: Chaudhary Group’s Resource Mapping
Business: Nepal’s largest FMCG company (e.g., Himalayan Salt, Bhatbhateni). Resource Mapping Strategy:
- Physical: Mapped supply chain routes to reduce transport costs.
- Human: Trained sales teams in digital marketing (intangible upskill).
- Financial: Used BCG Matrix to divest from low-growth brands (e.g., old spices line).
Result: 40% increase in market share in 5 years.
Exam Tip
- Case Studies: Always link resources to real examples (e.g., "Like Daraz’s warehouse mapping, [your answer] shows how physical resources can cut costs").
- Templates: For questions like "What resource mapping is needed for a business?", use the 6-step template above.
- Visuals: Draw SWOT, VRIO, or BCG matrices in exams—they double your marks for clarity.
- Avoid: Generic answers like "resource mapping is important." Show how it applies (e.g., "Nabil Bank used customer data mapping to reduce loan defaults by 25%").
- Past Exam Pattern:
- Short answers: Define visualization methods (SWOT, mind maps).
- Long answers: Analyze a case (like Rashmi Garments) using SWOT + VRIO.
Final Note: Resource mapping is not just theory—it’s how Daraz beats local shops, Nabil Bank outsmarts competitors, and Himalayan Java sells premium coffee. Master the tools (SWOT, BCG), templates, and real-world ties, and you’ll ace this unit!
Based on the TU BBM syllabus for Entrepreneurship and Business Resource Mapping (MGT237), unit 8.
Discussion
Loading…