Business StatisticsUnit 57 min read
Probability and Probability Distributions – Core Concepts
Unit 5 of Business Statistics: introduces probability fundamentals, event operations, conditional probability, Bayes theorem, discrete and continuous distributions, and their applications in business contexts.
Key points
- Probability quantifies uncertainty; sample space and events form the foundation.
- Conditional probability and independence determine how events influence each other.
- Bayes theorem updates beliefs with new evidence.
- Discrete distributions (binomial, Poisson, geometric, hypergeometric) model count data; continuous distributions (normal, uniform, exponential) model continuous outcomes.
- Real‑world business decisions rely on probability models for risk assessment, forecasting, and quality control.
1. Probability Basics
Probability measures the likelihood of an event occurring within a sample space .
where .
1.1 Sample Space and Events
| Symbol | Meaning | Example |
|---|---|---|
| Set of all possible outcomes | for a die | |
| Event | Rolling an even number |
1.2 Worked Example – Card Draw
A standard deck has 52 cards: 26 black, 26 red.
- Probability of drawing a black card:
- Probability of drawing a king:
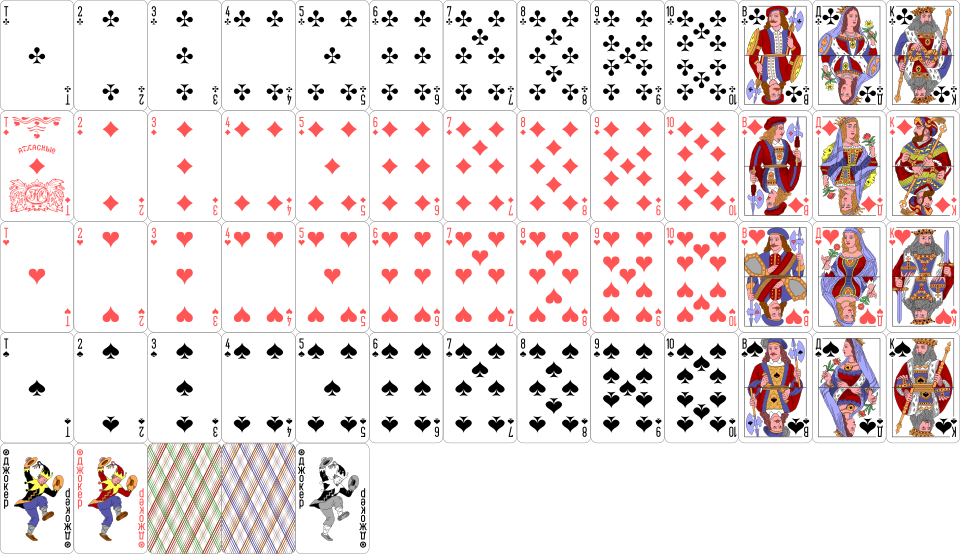 Standard deck of 52 playing cards (Image: Dbojan77, CC0, via Wikimedia Commons)
2. Operations on Events
| Operation | Symbol | Formula | Example |
|---|---|---|---|
| Union | Probability of drawing a heart or a king | ||
| Intersection | Probability of drawing a king that is also a heart | ||
| Complement | Probability of not drawing a spade |
2.1 Venn Diagram
3. Conditional Probability & Independence
Conditional probability of given :
Two events are independent if .
3.1 Worked Example – Scholarship
Assuming independence:
4. Bayes Theorem
Updates prior probabilities with new evidence.
4.1 Mermaid Flowchart
4.2 Real‑World Example – Credit Card Fraud
- Prior probability of fraud .
- Probability of a flagged transaction given fraud .
- Probability of a flagged transaction overall .
Posterior:
Thus, a flagged transaction has an 18 % chance of being fraudulent.
5. Discrete Probability Distributions
| Distribution | Parameters | PMF | Typical Use |
|---|---|---|---|
| Binomial | Successes in trials | ||
| Poisson | Rare events per interval | ||
| Geometric | First success time | ||
| Hypergeometric | Sampling without replacement |
5.1 Worked Example – Daraz Order Queue
Assume Daraz receives on average orders per minute.
Probability of receiving exactly 3 orders in a minute:
5.2 Binomial Example – Customer Satisfaction
A survey of 20 customers shows 15 are satisfied.
.
6. Continuous Probability Distributions
| Distribution | Parameters | Typical Use | |
|---|---|---|---|
| Uniform | Random time between events | ||
| Normal | Measurement errors, salaries | ||
| Exponential | Time between arrivals |
6.1 Worked Example – Delivery Time
Assume delivery times are normally distributed with days, .
Probability of delivery within 2.5 days:
6.2 Exponential Example – Call Drop
Call drop rate per minute.
Probability that a call lasts more than 5 minutes:
7. Applications in Business
| Business Context | Probability Concept | How It Is Used |
|---|---|---|
| eSewa transaction success | Conditional probability | Estimate success rate given network conditions |
| Daraz order queue | Poisson distribution | Forecast peak order times |
| Ncell coverage | Binomial distribution | Calculate probability of coverage in a region |
| NEPSE price movement | Normal distribution | Value‑at‑risk calculations |
| Pathao delivery | Exponential distribution | Estimate average waiting time |
7.1 Real‑World Example – eSewa Transaction Success
Let = successful transaction, = network stable.
, .
Overall success probability:
Assuming :
Thus, eSewa can claim a 97.3 % success rate under typical conditions.
7.2 Real‑World Example – Ncell Coverage
A city has 1000 households. Survey shows 850 have coverage.
Probability that a randomly chosen household has coverage:
If a new tower is planned, the company uses binomial distribution to estimate the number of households that will gain coverage.
8. Summary of Key Formulas
| Concept | Formula |
|---|---|
| Probability of event | |
| Union | |
| Conditional | |
| Independence | |
| Bayes | |
| Binomial | |
| Poisson | |
| Normal | |
| Exponential |
In the Real World
- Daraz Order Queue – Poisson distribution models the number of orders per minute, helping the logistics team allocate delivery staff during peak hours.
- Ncell Network Coverage – Binomial distribution estimates the probability that a new tower will cover at least 90 % of households, guiding investment decisions.
- NEPSE Price Movement – Normal distribution underpins value‑at‑risk calculations for investors, determining the probability of a 5 % drop in a day.
Exam Tip
- Know the formulas: Write them on a cheat sheet; you’ll often be asked to apply them directly.
- Work through worked examples: Practice with card, dice, and real‑world scenarios.
- Draw trees and Venn diagrams: They help in conditional probability and event operations questions.
- Use tables: For probability distributions, tabulate probabilities for small values to check your calculations.
- Check assumptions: Independence, identical trials, and sample size are common traps.
Good luck!
Based on the TU BBS syllabus for Business Statistics (MGT207), unit 5.
Discussion
Loading…