Cost and Management AccountingUnit 1019 min read
Contract Costing & Replacement Decisions: Methods, Analysis & Real-World Applications
Unit 10 of Cost and Management Accounting covers contract costing principles (including percentage-of-completion vs. completed-contract methods), replacement decision analysis (using incremental cost approach), and practical applications in Nepali industries like construction and infrastructure projects. Learn how to a
TAKEAWAYS:
- Contract costing tracks revenue and costs for long-term projects (e.g., construction, infrastructure) using either percentage-of-completion (recognizing profit as work progresses) or completed-contract (recognizing profit only at completion).
- Replacement decisions compare incremental costs (difference in costs between old and new assets) to justify upgrades, using metrics like annual savings or payback period.
- Key formulas:
- Percentage-of-completion profit =
(Work done/Total work) × Total estimated profit. - Incremental cost =
(Cost of new asset – Salvage value of old asset) + Annual savings.
- Percentage-of-completion profit =
- Real-world ties: NTC uses contract costing for telecom tower projects; Daraz’s warehouse expansions rely on replacement decisions for machinery.
- Exam focus: Numerical problems dominate (30–50% of marks). Master tracing costs to contracts, calculating profit recognition, and comparing replacement scenarios.
- Common pitfalls: Ignoring unabsorbed overheads in contract costing or misapplying time value of money in replacement analysis.
1. Contract Costing: Definitions and Methods
Contract costing is used for long-term projects (e.g., building a bridge, erecting a telecom tower, or constructing a residential complex) where work spans multiple accounting periods. Unlike job order costing (for short-term jobs), contract costing allocates costs and revenues over the project’s lifespan.
Key Terms
| Term | Definition | Example |
|---|---|---|
| Contract | A legally binding agreement for a specific output (e.g., constructing 100 houses). | NTC’s contract to build 50 telecom towers in Kathmandu Valley. |
| Contract Price | Total agreed revenue for completing the contract. | Rs. 500 million for a 5-year road construction project. |
| Estimated Cost | Total expected cost to complete the contract. | Rs. 450 million for the same road project. |
| Estimated Profit | Contract Price – Estimated Cost. |
Rs. 50 million (500M – 450M). |
| Work Certified | Portion of work approved by the client (used to recognize revenue). | 30% of the road project certified after Year 1. |
| Unabsorbed Overheads | Overheads not allocated to contracts (e.g., idle machinery costs). | Rs. 10 million of factory overheads unallocated in Year 1. |
Two Methods of Revenue Recognition
Contract costing uses two primary methods to recognize revenue and profit:
A. Percentage-of-Completion Method (Accrual Basis)
- Revenue and profit are recognized proportionally as work progresses.
- Used when: Work can be reliably measured (e.g., % of physical completion).
- Formula:
Profit for the period = (Work done/Total estimated work) × Total estimated profit - Advantages:
- Matches revenue with expenses (accrual accounting).
- Provides better financial visibility for stakeholders.
- Disadvantages:
- Requires accurate estimates of total work and costs.
- Complexity in measuring "work done" (e.g., for software projects).
B. Completed-Contract Method (Cash Basis)
- Revenue and profit are recognized only upon completion.
- Used when: Work cannot be reliably measured (e.g., research projects).
- Advantages:
- Simpler to implement.
- Avoids estimation risks.
- Disadvantages:
- Distorts financial statements (revenue/profit lags).
- May violate accrual principles.
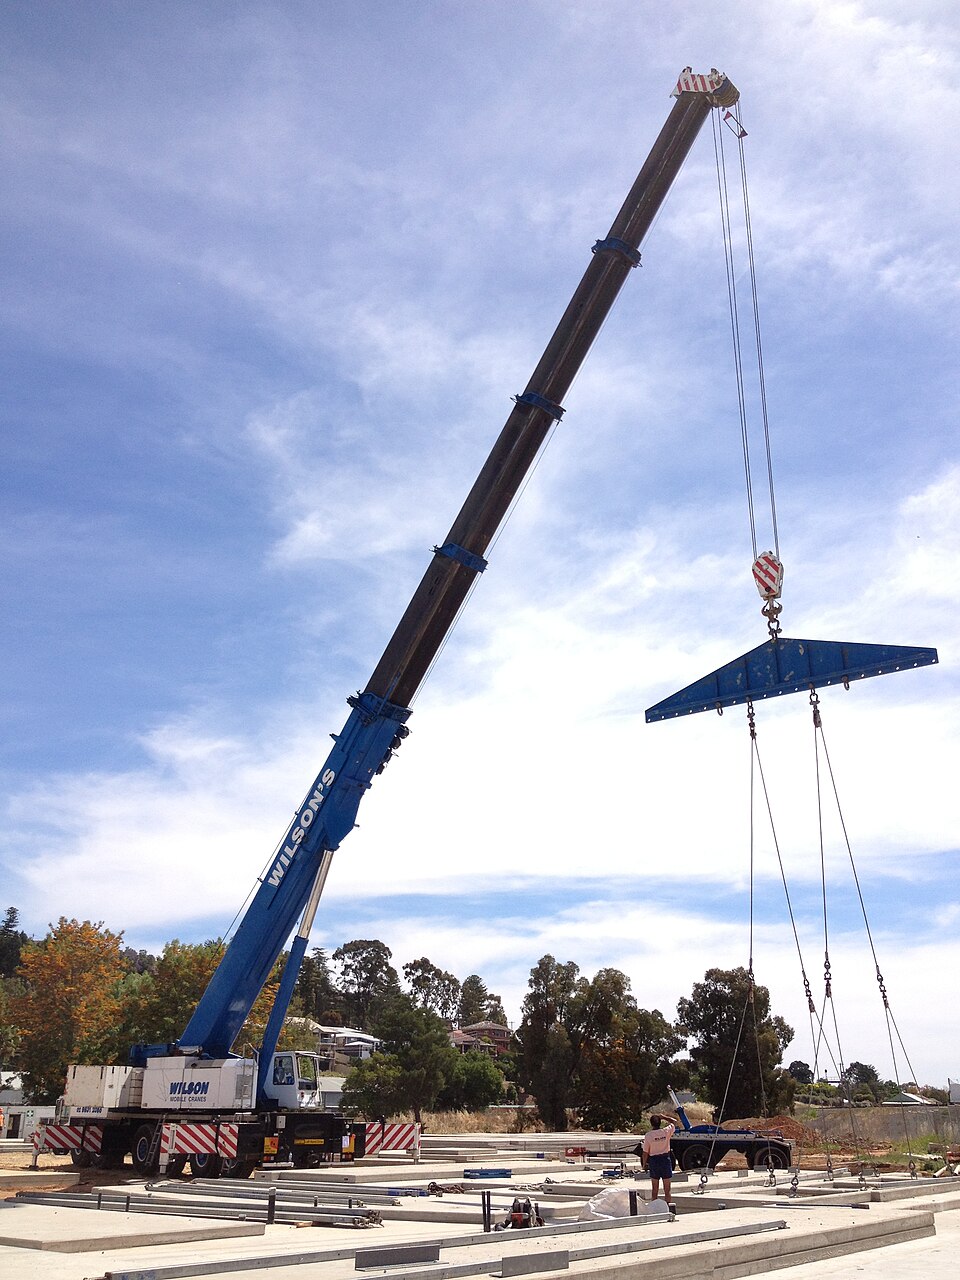 Contract costing in action (e.g., Kathmandu’s Ring Road expansion) (Image: Bidgee, CC BY-SA 3.0 au, via Wikimedia Commons)
2. How Contract Costing Works: A Step-by-Step Trace
Let’s trace a 3-year contract for Kathmandu Metropolitan City (KMC) to build a new drainage system in Thapathali.
Given Data
| Particulars | Details |
|---|---|
| Contract Price | Rs. 300 million |
| Estimated Cost | Rs. 250 million |
| Estimated Profit | Rs. 50 million (300M – 250M) |
| Work Progress | Year 1: 40%, Year 2: 35%, Year 3: 25% (completion) |
| Actual Costs | Year 1: Rs. 80 million, Year 2: Rs. 100 million, Year 3: Rs. 70 million |
Year 1: Percentage-of-Completion Method
Work Certified: 40% of total work.
Profit Recognized:
Profit = (40/100) × 50M = Rs. 20 millionRevenue Recognized:
Revenue = (40/100) × 300M = Rs. 120 millionJournal Entry:
| Particulars | Dr (Rs.) | Cr (Rs.) | |---------------------------|----------|----------| | Work-in-Progress (WIP) | 80,000,000 | | | Contract Revenue | | 120,000,000 | | Profit on Contract | 20,000,000 | | | Cash/Bank | | 80,000,000 | | **Total** | **100,000,000** | **200,000,000** |- Explanation:
- WIP is debited for actual costs (Rs. 80M).
- Revenue is credited for 40% of contract price (Rs. 120M).
- Profit (Rs. 20M) is recognized immediately.
- Explanation:
Balance Sheet Impact:
- Asset (WIP): Rs. 80M (cost) + Rs. 20M (profit) = Rs. 100M.
- Liability (Billings): Rs. 120M (revenue recognized).
Year 2: Continuing the Contract
- Work Certified: Cumulative 75% (40% + 35%).
- Profit Recognized in Year 2:
Total profit for 75% = (75/100) × 50M = Rs. 37.5M Profit in Year 2 = 37.5M – 20M (Year 1) = Rs. 17.5M - Revenue Recognized:
Revenue = (75/100) × 300M = Rs. 225M - Journal Entry:
| Particulars | Dr (Rs.) | Cr (Rs.) | |---------------------------|----------|----------| | WIP | 100,000,000 | | | Contract Revenue | | 225,000,000 | | Profit on Contract | 17,500,000 | | | Cash/Bank | | 100,000,000 | | **Total** | **117,500,000** | **325,000,000** |- Note: Only Rs. 17.5M profit is recognized in Year 2 (not Rs. 37.5M).
Year 3: Completion
- Work Certified: 100%.
- Profit Recognized:
Remaining profit = 50M – (20M + 17.5M) = Rs. 12.5M - Journal Entry:
| Particulars               | Dr (Rs.) | Cr (Rs.) |
|---------------------------|----------|----------|
| WIP                       | 70,000,000 |          |
| Contract Revenue          |          | 300,000,000 |
| Profit on Contract        | 12,500,000 |          |
| Cash/Bank                 |          | 70,000,000 |
| **Total**                 | **82,500,000** | **370,000,000** |
MERMAID DIAGRAM: Contract Costing Cycle
flowchart TD
    A["Start Contract\n(Year 0)"] --> B["Estimate Total Cost & Profit"]
    B --> C["Year 1: Incur Costs\nMeasure Work Progress"]
    C --> D["Recognize Revenue & Profit\n(Percentage-of-Completion)"]
    D --> E["Year 2: Repeat\nCosts & Progress"]
    E --> F["Update WIP & Profit"]
    F --> G["Year 3: Complete\nFinalize Accounts"]
    G --> H["Close Contract\nTransfer Profit to P&L"]
3. Handling Overheads and Unabsorbed Costs
In contract costing, overheads (indirect costs like rent, salaries) are allocated to contracts using a predetermined overhead rate:
Overhead Rate = (Total Estimated Overheads) / (Total Estimated Direct Costs)
Example: If total overheads are Rs. 50M and direct costs Rs. 200M, the rate is 25% (50M/200M).
Unabsorbed Overheads
If actual overheads exceed allocated overheads, the unabsorbed amount is treated as:
- Loss (if recognized in profit and loss).
- Part of WIP (if carried forward).
Journal Entry for Unabsorbed Overheads:
| Particulars               | Dr (Rs.) | Cr (Rs.) |
|---------------------------|----------|----------|
| Profit & Loss A/c         | 10,000,000 |          |
| Factory Overhead A/c      |          | 10,000,000 |
4. Replacement Decisions: Theory and Application
Replacement decisions involve comparing the costs of retaining an old asset vs. purchasing a new one. The key is to focus on incremental costs (differences between the two options).
Key Concepts
| Term | Definition | Example |
|---|---|---|
| Incremental Cost | Additional cost incurred by choosing one option over another. | Buying a new machine costs Rs. 5M vs. repairing the old one for Rs. 2M. |
| Annual Savings | Reduction in costs from using the new asset (e.g., lower maintenance, higher efficiency). | New machine saves Rs. 1M/year in labor costs. |
| Payback Period | Time taken to recover the incremental cost from annual savings. | Rs. 5M / Rs. 1M = 5 years. |
| Time Value of Money | Future savings are discounted to present value (NPV analysis). | Rs. 1M saved in Year 5 is worth less today. |
Step-by-Step Replacement Decision Analysis
Scenario: Kathmandu Wool Industries is considering replacing an old weaving machine.
- Old Machine:
- Book Value: Rs. 2,000,000
- Salvage Value (now): Rs. 300,000
- Annual Maintenance: Rs. 500,000
- Remaining Life: 5 years
- New Machine:
- Cost: Rs. 4,000,000
- Salvage Value (after 5 years): Rs. 500,000
- Annual Maintenance: Rs. 100,000
- Life: 5 years
- Assumptions:
- No income tax effects.
- Discount rate: 10%.
Step 1: Calculate Incremental Cost
Incremental Cost = (Cost of new machine – Salvage value of old machine)
                 = (4,000,000 – 300,000)
                 = Rs. 3,700,000
Step 2: Calculate Annual Savings
Annual Savings = (Maintenance of old – Maintenance of new)
               = (500,000 – 100,000)
               = Rs. 400,000
Step 3: Compute Payback Period
Payback Period = Incremental Cost / Annual Savings
               = 3,700,000 / 400,000
               = 9.25 years
Conclusion: The payback period exceeds the machine’s life (5 years), so do not replace (without considering other factors like efficiency gains).
Step 4: Net Present Value (NPV) Approach (Advanced)
If we discount the annual savings at 10%:
NPV = -3,700,000 + (400,000 / 1.1^1) + (400,000 / 1.1^2) + ... + (400,000 / 1.1^5)
    ≈ -3,700,000 + 1,635,000 (present value of savings)
    ≈ -2,065,000 (Negative NPV → Reject)
MERMAID DIAGRAM: Replacement Decision Flowchart
flowchart TD
    A["Old Asset vs. New Asset?"] --> B["Calculate Incremental Cost"]
    B --> C["Estimate Annual Savings"]
    C --> D["Compute Payback Period"]
    D --> E{"Payback ≤ Asset Life?"}
    E -->|"Yes"| F["Consider NPV/DCF"]
    E -->|"No"| G["Reject Replacement"]
    F --> H{"NPV > 0?"}
    H -->|"Yes"| I["Accept Replacement"]
    H -->|"No"| G
5. Real-World Applications in Nepal
Example 1: NTC’s Telecom Tower Construction
- Contract Type: Long-term construction (3–5 years).
- Method Used: Percentage-of-completion (NTC requires progress-based billing).
- Why? Ensures NTC pays contractors fairly as towers are built, improving cash flow for both parties.
- Challenge: Accurately measuring "work done" (e.g., % of steelwork completed).
Example 2: Daraz’s Warehouse Automation
- Scenario: Daraz is replacing old conveyor belts in its warehouse.
- Decision: Compare incremental costs of new belts (Rs. 8M) vs. annual savings (Rs. 1.5M/year).
- Outcome: Payback period = 5.33 years → Justified if belts last >5 years.
Example 3: Kathmandu’s Public Bus Fleet
- Harati Yatayat Sewa (a public bus company) must decide whether to:
- Repair old buses (cost: Rs. 2M/bus, life: 2 years).
- Buy new buses (cost: Rs. 8M/bus, life: 10 years, lower fuel costs).
- Analysis:
- Incremental Cost: Rs. 8M – Rs. 2M = Rs. 6M.
- Annual Savings: Rs. 1.2M (fuel + maintenance).
- Payback: 6M / 1.2M = 5 years (within new bus life).
6. Comparison Table: Contract Costing vs. Job Order Costing
| Feature | Contract Costing | Job Order Costing |
|---|---|---|
| Project Duration | Long-term (months/years). | Short-term (days/weeks). |
| Revenue Recognition | Spread over time (percentage-of-completion). | Recognized upon completion. |
| Cost Allocation | Overheads allocated to contracts. | Overheads allocated to specific jobs. |
| Examples | Construction, infrastructure, large manufacturing contracts. | Custom furniture, printing jobs, event management. |
| Complexity | High (requires work certification). | Low (direct cost tracing). |
| Financial Statements | WIP account used; profit recognized gradually. | No WIP; profit recognized at job completion. |
7. Common Mistakes in Exams
- Ignoring Unabsorbed Overheads: Always check if overheads are fully absorbed in contracts.
- Miscounting Work Progress: Ensure percentages add up to 100% at completion.
- Forgetting Salvage Value: In replacement decisions, subtract old asset’s salvage value from new cost.
- Mixing Methods: Don’t use percentage-of-completion for a completed-contract scenario.
- Time Value Errors: In NPV calculations, discount future savings correctly.
8. Worked Example: Combined Contract Costing and Replacement
Scenario: Everest Engineering has a 2-year contract to build a hydroelectric dam for NEPSE. They must also decide whether to replace an old excavator.
Part A: Contract Costing
| Particulars | Year 1 | Year 2 |
|---|---|---|
| Contract Price | Rs. 200M | Rs. 200M |
| Estimated Cost | Rs. 150M | Rs. 150M |
| Estimated Profit | Rs. 50M | |
| Work Progress | 60% | 40% (completion) |
| Actual Costs | Rs. 90M | Rs. 60M |
Year 1 Entries:
Profit = (60/100) × 50M = Rs. 30M
Revenue = (60/100) × 200M = Rs. 120M
Journal Entry:
| Particulars               | Dr (Rs.) | Cr (Rs.) |
|---------------------------|----------|----------|
| WIP                       | 90,000,000 |          |
| Contract Revenue          |          | 120,000,000 |
| Profit on Contract        | 30,000,000 |          |
| Cash/Bank                 |          | 90,000,000 |
Part B: Replacement Decision
- Old Excavator:
- Book Value: Rs. 10M
- Salvage Value: Rs. 2M
- Annual Maintenance: Rs. 3M
- Life: 3 years
- New Excavator:
- Cost: Rs. 20M
- Salvage Value: Rs. 4M
- Annual Maintenance: Rs. 1M
- Life: 5 years
Incremental Cost:
20M (new) – 2M (old salvage) = Rs. 18M
Annual Savings:
3M (old) – 1M (new) = Rs. 2M
Payback Period:
18M / 2M = 9 years > 5 years (new life) → **Reject**
## In the Real World
NTC’s Telecom Expansion
- What’s Used: Percentage-of-completion method for tower construction contracts.
- How: NTC pays contractors 60% of the contract value after 60% of the tower is physically completed (verified by independent auditors).
- Why: Ensures funds are used efficiently and contractors stay solvent during long projects.
Daraz’s Warehouse Automation
- What’s Used: Replacement decision analysis for conveyor belts and sorting machines.
- How: Daraz calculates payback periods for new equipment. For example, replacing a Rs. 5M forklift that saves Rs. 800K/year in labor gives a 6.25-year payback—justified if the forklift lasts 8+ years.
- Nepali Tie: Daraz’s Kathmandu warehouse uses this to optimize order fulfillment speed.
Kathmandu’s Road Construction (KMC Contracts)
- What’s Used: Completed-contract method for small, short-term road repairs (where work progress is hard to measure).
- Example: A Rs. 20M contract to repair 10 km of roads in Chobhar might recognize zero profit until the entire project is certified "complete" by KMC engineers.
- Challenge: Delays in certification can strain contractor cash flow.
Nepal Electricity Authority (NEA) Dam Projects
- What’s Used: Contract costing with overhead absorption.
- How: NEA allocates central overheads (e.g., HQ salaries) to dam projects based on direct labor hours. If a project runs over budget, unabsorbed overheads are treated as a loss for the year.
## Exam Tip: How to Score Full Marks
For Contract Costing Problems:
- Always show work progress percentages and how they relate to profit recognition.
- Label WIP, revenue, and profit clearly in journal entries.
- Mention unabsorbed overheads if given (even if zero).
For Replacement Decisions:
- Calculate incremental cost first (most students miss this).
- Compare payback period to asset life—this is the key decision criterion in basic problems.
- For advanced questions, use NPV (but only if asked).
Numerical Accuracy:
- Double-check percentages (e.g., 60% + 40% = 100%).
- Use tables for contract costing traces (examiners love this).
Theoretical Questions:
- Define percentage-of-completion and completed-contract clearly.
- Mention advantages/disadvantages of each method (e.g., accrual vs. cash basis).
Real-World Links:
- If asked about applications, name NTC, Daraz, or KMC and tie to contract costing/replacement.
- Example answer: "NTC uses percentage-of-completion for telecom tower contracts to ensure fair revenue recognition as towers are built."
MERMAID DIAGRAM: Exam Checklist
mindmap
  root((Contract Costing & Replacement Exam Tips))
    Contract Costing
      Work Progress %s
      Profit Recognition Formula
      Journal Entries (WIP, Revenue, Profit)
      Unabsorbed Overheads
    Replacement Decisions
      Incremental Cost Calculation
      Annual Savings
      Payback Period vs. Asset Life
      NPV (if advanced)
    General
      Label All Figures
      Show Workings Clearly
      Use Tables for Traces
      Link to Real-World (NTC/Daraz)
Based on the TU BBS syllabus for Cost and Management Accounting (MGT212), unit 10.
Discussion
Loading…