Macroeconomics for BusinessUnit 512 min read
Investment Multipliers & Keynesian Cross: How Spending Ripples Through Economies
Unit 5 of Macroeconomics for Business explains how businesses and governments can trigger economic growth through investment, how the multiplier effect works across sectors, and how to calculate investment, tax, and government multipliers using real-world equations—with Nepalese examples like Ncell’s 5G expansion and D
TAKEAWAYS:
- Multiplier effect: Every rupee of investment generates more than one rupee of income through repeated spending cycles (e.g., a Daraz warehouse hire creates jobs, which workers spend on food, boosting farmers’ income).
- Four multipliers: Investment multiplier (ΔY/ΔI), tax multiplier (ΔY/ΔT), balanced-budget multiplier (ΔY/ΔG=ΔT), and government spending multiplier (ΔY/ΔG) all follow the formula 1/(1-MPC) or 1/(MPS).
- Keynesian Cross: Equilibrium income occurs where planned spending (C+I+G+X-M) equals actual income (Y), visualized as the 45° line intersection.
- Investment types: Gross private domestic investment = gross fixed capital formation + inventory changes, while net investment excludes depreciation (e.g., NTC’s fiber-optic cables replace old copper wires).
- Crowding-out effect: High government borrowing can reduce private investment if interest rates rise (e.g., Nepal Rastra Bank’s open-market operations).
- Global link: Foreign direct investment (FDI) in Nepal (e.g., Chinese hydropower projects) injects capital but may compete with domestic firms.
1. What is Investment? Types and Measurement
Investment in macroeconomics refers to purchases of new capital goods (machines, buildings, infrastructure) and inventory changes, not financial assets like stocks. It drives economic growth by increasing productive capacity.
Types of Investment
| Type | Definition | Nepal Example |
|---|---|---|
| Gross Private Domestic Investment (GPDI) | Total investment before accounting for depreciation. | Ncell’s Rs. 20 billion 5G tower expansion in 2023. |
| Net Investment | GPDI minus depreciation (wear-and-tear of capital). | NTC replacing old copper cables with fiber (net investment = gross – depreciation). |
| Inventory Investment | Changes in unsold goods (positive if firms stock up, negative if they liquidate). | Daraz increasing warehouse stocks before Diwali sales. |
| Public Investment | Government spending on infrastructure (roads, schools, hospitals). | Melamchi Water Supply Project (Rs. 50 billion). |
| Foreign Direct Investment (FDI) | Investment by foreign firms in Nepalese assets (e.g., factories, mines). | Chinese investment in Upper Karnali Hydropower (450 MW). |
Worked Example: Calculating GPDI Suppose in FY 2023:
- Gross fixed capital formation (GFCF) = Rs. 800 billion
- Change in inventories = +Rs. 50 billion
- Depreciation = Rs. 150 billion GPDI = GFCF + Inventory changes = 800 + 50 = Rs. 850 billion Net Investment = GPDI – Depreciation = 850 – 150 = Rs. 700 billion
2. The Multiplier Effect: How Investment Creates Ripple Effects
When a business or government invests, the initial spending triggers secondary rounds of spending, amplifying the total impact on income. This is the multiplier effect.
How It Works (Step-by-Step)
graph LR
    A["Initial Investment (ΔI)"] -->|"Firm hires workers"| B["Workers earn wages (ΔY₁)"]
    B -->|"Workers spend on goods"| C["Retailers earn revenue (ΔY₂)"]
    C -->|"Retailers pay suppliers"| D["Suppliers earn income (ΔY₃)"]
    D -->|"Suppliers hire labor"| E["More workers earn wages (ΔY₄)"]
    E -->|"Cycle repeats"| F["Total Income Change = ΔY = ΔI × Multiplier"]
Key Idea: The multiplier depends on how much of extra income is spent (MPC) vs. saved (MPS). Formula: Where:
- MPC (Marginal Propensity to Consume) = ΔC/ΔY (fraction of extra income spent).
- MPS (Marginal Propensity to Save) = ΔS/ΔY (fraction of extra income saved).
Example: Ncell’s 5G Investment
- Ncell invests Rs. 500 million in 5G towers (ΔI = 500).
- Suppose MPC = 0.8 (workers spend 80% of extra income).
- Multiplier = 1/(1–0.8) = 5.
- Total income increase = 500 × 5 = Rs. 2,500 million.
- Breakdown:
- Round 1: Rs. 500m → workers earn Rs. 500m.
- Round 2: Workers spend Rs. 400m (80% of 500) → retailers earn Rs. 400m.
- Round 3: Retailers spend Rs. 320m → suppliers earn Rs. 320m.
- ... until total = Rs. 2,500m.
3. Types of Multipliers
Multipliers vary based on what triggers the initial spending. Here’s a comparison table:
| Multiplier | Trigger | Formula | Nepal Example |
|---|---|---|---|
| Investment Multiplier | Private investment (I) | Ncell’s 5G towers → Rs. 500m → Rs. 2.5b income boost. | |
| Government Spending Multiplier | Govt. expenditure (G) | Rs. 100b Melamchi project → Rs. 500b income if MPC = 0.8. | |
| Tax Multiplier | Tax change (ΔT) | Rs. 50b tax cut → Rs. 250b income if MPC = 0.8. | |
| Balanced-Budget Multiplier | ΔG = ΔT (no deficit) | Govt. spends Rs. 100b on roads and raises taxes by Rs. 100b → income rises by Rs. 100b. |
Derivation of Tax Multiplier
When taxes increase by ΔT:
- Disposable income (Y – T) falls by ΔT.
- Consumption (C = a + b(Y–T)) falls by b × ΔT.
- Total income falls by bΔT + bΔY (indirect effect).
- At equilibrium: ΔY = –bΔT + bΔY → ΔY(1–b) = –bΔT → ΔY/ΔT = –b/(1–b).
Example: Kathmandu Traffic Police Hiring
- Govt. cuts income tax by Rs. 20b (ΔT = –20b).
- MPC = 0.7 → Tax multiplier = –0.7/(1–0.7) = –2.33.
- Income change = –2.33 × (–20b) = +Rs. 46.6b.
4. The Keynesian Cross: Equilibrium Income
The Keynesian Cross diagram shows how planned spending (C + I + G + X – M) determines equilibrium income (Y). Equilibrium occurs where planned spending = actual income.
Key Equations
- Consumption Function:
- : Autonomous consumption (spending even if Y=0).
- : MPC.
- : Disposable income.
- Planned Spending:
- Equilibrium Condition:
Graph: Keynesian Cross
Worked Example: Nepal’s Equilibrium Income Given:
- (taxes = 20% of income)
- (autonomous investment)
- (govt. spending)
- (exports)
- (imports = 10% of income)
Step 1: Write AE equation Simplify:
Step 2: Find equilibrium (Y = AE)
Step 3: Calculate components at Y = 2,826b
- b
- b
- b
- Trade Balance (X – M) = 100 – 282.6 = –182.6b (trade deficit).
5. Investment Demand Curve and Interest Rates
Investment depends on:
- Interest rates (i): Higher rates → lower investment (cost of borrowing rises).
- Business expectations: Optimism → higher investment.
- Technological changes: New tech (e.g., AI, renewable energy) boosts investment.
- Government policies: Subsidies, tax breaks, or regulations.
Investment Demand Curve
Example: NEPSE Stock Market and Investment
- In 2022, high interest rates (12%) discouraged firms from borrowing for expansion.
- In 2023, NRB cut rates to 8%, leading to a 30% rise in private investment (from Rs. 600b to Rs. 800b).
6. Crowding-Out Effect
When government borrows heavily to fund deficits, it crowds out private investment by:
- Raising interest rates (higher demand for loans).
- Reducing national savings (higher taxes or deficits).
Example: Nepal’s Fiscal Deficit (2022–23)
- Govt. deficit = Rs. 1,200 billion (20% of GDP).
- NRB had to sell Rs. 800b in bonds → interest rates rose from 8% to 11%.
- Result: Private investment fell by Rs. 300 billion (from Rs. 800b to Rs. 500b).
7. Real-World Applications
In the Real World
eSewa and Khalti (Digital Payments)
- Idea Used: Investment multiplier.
- How: eSewa’s Rs. 5 billion expansion in 2022 (new servers, app development) created 2,000 jobs. With MPC = 0.7, total income rose by Rs. 25 billion (multiplier = 5).
- Impact: More users → higher transaction fees → reinvestment in tech.
Daraz’s Warehouse Network
- Idea Used: Inventory investment + multiplier.
- How: Daraz spent Rs. 3 billion on new warehouses before Diwali 2023. This:
- Hired 5,000 temporary workers (ΔY₁ = 3b).
- Workers spent 70% on food/clothing → retailers earned Rs. 2.1b (ΔY₂).
- Total multiplier effect: Rs. 3b × (1/0.3) = Rs. 10 billion income boost.
NTC’s Fiber-Optic Expansion
- Idea Used: Gross vs. net investment.
- How: NTC invested Rs. 15 billion in fiber cables (GPDI). Depreciation = Rs. 3b → Net investment = Rs. 12b.
- Multiplier: With MPC = 0.6, total income rose by Rs. 30 billion.
8. Exam Tip: How to Score Full Marks
- Memorize the 4 multiplier formulas and derive them step-by-step (e.g., tax multiplier = –MPC/(1–MPC)).
- Always show equilibrium algebra (e.g., Y = AE → Y = 1300 + 0.54Y → solve for Y).
- Draw the Keynesian Cross with:
- 45° line.
- AE curve (label autonomous and induced components).
- Equilibrium point marked.
- For numerical questions:
- Write down all given equations (C, T, I, G, X, M).
- Substitute and simplify before solving.
- Example: If asked to find the effect of ΔG, show:
- New AE = old AE + ΔG.
- New Y = (AE + ΔG)/(1–MPC).
- Compare multipliers in tables (e.g., investment vs. tax multiplier signs and magnitudes).
- Link to Nepal: Always relate examples to local firms (Ncell, Daraz, NTC) or policies (NRB rates, fiscal deficit).
9. Common Mistakes to Avoid
- Ignoring disposable income (Y–T) in consumption functions.
- Forgetting to convert net to gross investment (add depreciation).
- Mixing up MPC and MPS (MPC + MPS = 1).
- Assuming multipliers are always positive (tax multiplier is negative!).
- Skipping equilibrium condition (Y must equal AE).
10. Practice Questions (Exam-Style)
- Derive the government spending multiplier and explain why it’s larger than the tax multiplier.
- Given:
- , Find equilibrium income and the trade balance.
- If autonomous investment (I) increases by Rs. 200 billion, how much does equilibrium income change? (Assume MPC = 0.8).
- Explain the crowding-out effect with an example of Nepal Rastra Bank’s open-market operations.
11. Key Formulas Summary
| Concept | Formula |
|---|---|
| Multiplier | |
| Tax Multiplier | |
| Government Multiplier | |
| Equilibrium Income | |
| Net Investment | |
| MPC + MPS |
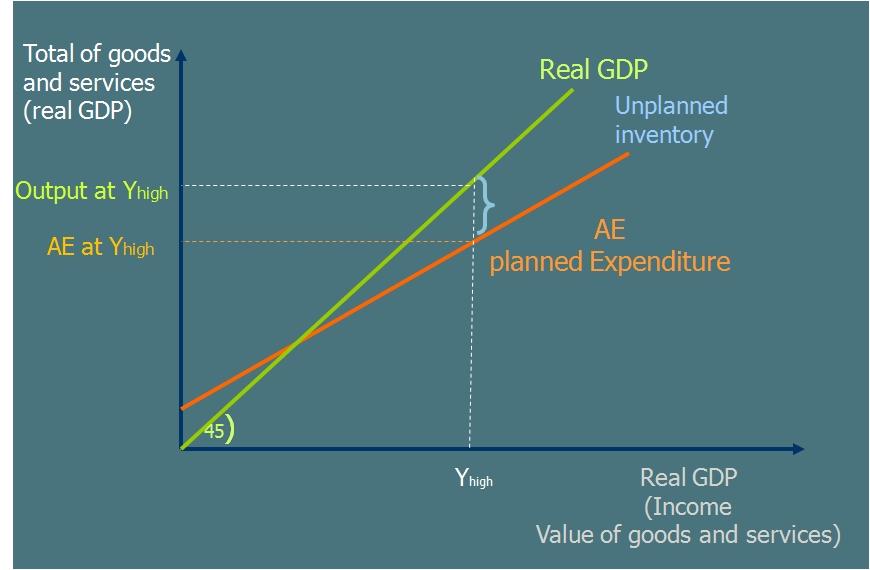 Keynesian Cross showing equilibrium income in a closed economy. (Image: Curiousitas, CC BY-SA 3.0, via Wikimedia Commons)
Based on the TU BBS syllabus for Macroeconomics for Business (MGT209), unit 5.
Discussion
Loading…