Fundamentals Of Corporate FinanceUnit 315 min read
Working Capital Management: Liquidity, Efficiency & Cash Flow
Unit 3 of Fundamentals Of Corporate Finance: Explores how businesses manage short-term assets/liabilities to ensure operational efficiency, liquidity, and profitability—covering working capital needs, financing strategies, inventory management, receivables/payables optimization, and cash flow forecasting with real-worl
TAKEAWAYS:
- Working capital is the difference between current assets and current liabilities, and its management ensures a firm can meet short-term obligations while avoiding excess idle funds.
- The working capital cycle (cash-to-cash conversion) is critical: Cash → Inventory → Receivables → Cash, and its length directly impacts profitability.
- Financing strategies (short-term vs. long-term) must align with the firm’s cash flow needs—over-trading risks insolvency, while under-trading wastes potential revenue.
- Inventory management (EOQ, ABC analysis) and credit policies (terms like 2/10 net 30) directly affect working capital efficiency and customer retention.
- Cash flow forecasting uses techniques like the percentage-of-sales method to predict liquidity needs and avoid stockouts or overstocking.
- Optimal working capital balances risk (insolvency) and opportunity cost (lost sales due to tight liquidity), often modeled via financial ratios (current ratio, quick ratio).
1. Definitions and Core Concepts
Working capital (WC) is the net amount of a firm’s short-term assets (cash, receivables, inventory) minus its short-term liabilities (payables, short-term debt). It measures a company’s liquidity—its ability to cover day-to-day expenses without selling long-term assets.
Key Terms
Net Working Capital (NWC): A positive NWC means the firm can pay its short-term debts; negative NWC signals potential liquidity crises.
Working Capital Cycle (Cash Conversion Cycle, CCC): The time between cash outflow (purchasing inventory) and cash inflow (receiving payment from customers). Shorter cycles improve efficiency.
Over-Trading vs. Under-Trading:
- Over-trading: Financing operations with short-term debt, risking insolvency if sales drop.
- Under-trading: Holding excessive cash/inventory, wasting potential revenue.
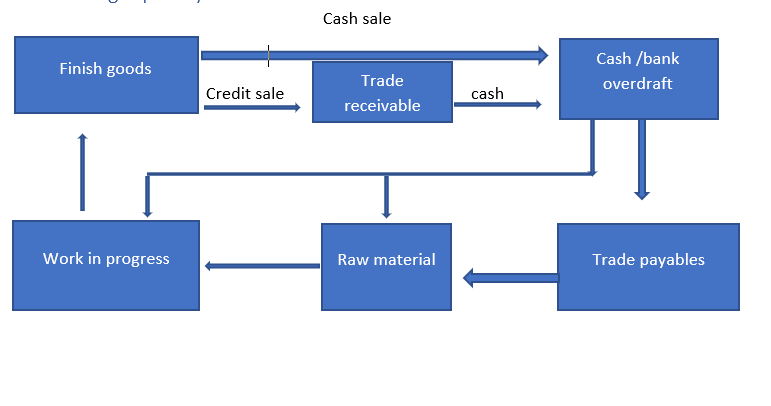 working capital cycle diagram (Image: Saroj Cheema, CC BY-SA 4.0, via Wikimedia Commons)
| Step | Days (Example) | Impact |
|---|---|---|
| Cash → Inventory | 30 | Longer = higher storage costs. |
| Inventory → Sales | 60 | Slow sales = tied-up capital. |
| Sales → Receivables | 45 | Credit terms affect collection speed. |
| Receivables → Cash | 15 | Aggressive collection shortens CCC. |
2. Working Capital Needs and Financing Strategies
Firms require working capital to:
- Maintain operational continuity (pay suppliers, wages, utilities).
- Take advantage of discounts (e.g., 2/10 net 30 in Nepal’s supply chains).
- Meet unexpected demands (e.g., sudden Daraz order surges).
Financing Working Capital
| Source | Type | Pros | Cons |
|---|---|---|---|
| Short-term loans | Bank overdraft | Flexible, quick access. | High interest, risk of default. |
| Trade credit | Supplier terms | No upfront cost (e.g., 30-day payables). | Loses cash discounts if paid late. |
| Commercial paper | Promissory notes | Lower cost than bank loans. | Requires strong credit rating. |
| Factoring | Receivables sale | Immediate cash inflow. | High fees (1-5% of receivables). |
| Long-term debt | Term loans | Lower interest than short-term. | Long commitment, higher risk if sales drop. |
Supplier: "2/10 net 30"
- Buy now, pay 98% of invoice in 10 days → **2% discount**.
- Pay full amount in 30 days if no discount taken.
Example: A Kathmandu retailer buys Rs 500,000 worth of goods. Option 1: Pay Rs 490,000 in 10 days (saves Rs 10,000). Option 2: Pay Rs 500,000 in 30 days (no discount). Trade-off: Cash flow vs. savings.
3. Managing Current Assets
mindmap
  root((Inventory Management))
    ABC Analysis
      A Items
        - Electronics (10% of items, 70% of value)
        - Example: Smartphones at ‘Prakash’ shop
      B Items
        - Stationery (20% items, 20% value)
      C Items
        - Packaging (70% items, 10% value)
    EOQ Calculation
      - Formula: √(2DS/H)
      - Example: Daraz warehouse (10,000 units/year, Rs 500/order, Rs 20/unit/year)
        → Order 707 units every 14 days
ABC analysis and EOQ decision tree for ‘Prakash’ Retail Shop’s inventory.A. Inventory Management
Inventory ties up capital; inefficient management leads to stockouts (lost sales) or obsolete stock (wasted funds).
Key Strategies:
Economic Order Quantity (EOQ): Minimizes ordering costs and holding costs. Where:
- = Annual demand (units)
- = Ordering cost per order (Rs)
- = Holding cost per unit per year (Rs)
Example: A Daraz warehouse stocks 10,000 units/year of a product. Ordering costs Rs 500/order; holding cost is Rs 20/unit/year. Interpretation: Order 707 units every ~14 days to minimize costs.
ABC Analysis: Classifies inventory into A (high value, low volume), B (medium), C (low value, high volume) to prioritize control.
Category % of Items % of Value Control Strategy A 10% 70% Strict tracking, JIT. B 20% 20% Moderate control. C 70% 10% Bulk ordering, minimal checks.
A: 10% items, 70% value (e.g., electronics)
B: 20% items, 20% value (e.g., stationery)
C: 70% items, 10% value (e.g., packaging)
B. Accounts Receivable (AR) Management
AR represents uncollected sales revenue. Poor collection policies hurt cash flow.
Strategies:
- Credit Policy: Define terms (e.g., "net 30") and credit limits.
- Discounts for Early Payment: Encourage faster collections (e.g., 1% discount if paid in 10 days).
- Factoring: Sell receivables to a third party for immediate cash (common in Pathao’s rider payments).
Example: A Pathao driver earns Rs 5,000/month but waits 30 days for payment. If Pathao factors receivables, the driver gets Rs 4,700 upfront (with a 6% fee), improving liquidity.
| Age of Receivable | Amount (Rs) | % of Total |
|---|---|---|
| 0–30 days | 600,000 | 60% |
| 31–60 days | 200,000 | 20% |
| 61–90 days | 100,000 | 10% |
| >90 days | 100,000 | 10% |
Red flag: >90 days receivables may indicate credit risks.
4. Managing Current Liabilities
Current liabilities (e.g., trade payables, short-term loans) should be managed to delay payments (to preserve cash) while avoiding penalties.
Strategies:
- Cash Discounts: Take discounts to reduce payables (e.g., pay Rs 490,000 in 10 days instead of Rs 500,000 in 30 days).
- Negotiate Terms: Extend payable periods (e.g., from 30 to 60 days) if suppliers agree.
- Just-in-Time (JIT): Reduce inventory by receiving goods only when needed (used by Daraz for perishable goods).
Supplier → [Delivery only when needed] → Retailer → Customer
Benefit: Lowers holding costs but requires reliable suppliers.
5. Cash Flow Forecasting
Predicting future cash flows ensures the firm can meet obligations. Methods include:
A. Percentage-of-Sales Method
Assumes current assets/liabilities grow proportionally with sales.
Example: A Kathmandu retail shop has:
- Current Ratio = 1.5
- Projected Sales = Rs 12,000,000
- Current Liabilities = Rs 4,000,000
B. Cash Budget
Tracks inflows (sales, loans) and outflows (payroll, rent) over a period (e.g., quarterly).
| Month | Cash Inflows (Rs) | Cash Outflows (Rs) | Ending Balance (Rs) |
|---|---|---|---|
| January | 500,000 | 400,000 | 100,000 |
| February | 600,000 | 550,000 | 150,000 |
| March | 700,000 | 600,000 | 250,000 |
Use: Identifies months with cash deficits (need for short-term loans) or surpluses (investment opportunities).
Cash Balance (Rs)
|
500,000 |       _______
       |      /
       |     /
       |____/
       Jan Feb Mar
Trend: Rising cash balance suggests improving liquidity.
6. Working Capital Ratios
Ratios assess liquidity and efficiency:
| Ratio | Formula | Interpretation |
|---|---|---|
| Current Ratio | Current Assets / Current Liabilities | >1.5 = healthy; <1 = liquidity risk. |
| Quick Ratio | (Current Assets – Inventory) / CL | Excludes inventory (more stringent). |
| Cash Ratio | Cash / Current Liabilities | Strictest test of liquidity. |
| Inventory Turnover | COGS / Average Inventory | Higher = faster sales, less waste. |
| Receivables Turnover | Sales / Average Receivables | Higher = quicker collections. |
Example: A Ncell store has:
- Current Assets = Rs 2,000,000
- Current Liabilities = Rs 1,000,000
- Inventory = Rs 500,000
- COGS = Rs 1,200,000
- Average Receivables = Rs 300,000
- Annual Sales = Rs 3,600,000
7. Optimal Working Capital
Optimal WC balances:
- Risk of insolvency (too little WC).
- Opportunity cost (too much WC wastes capital).
Determinants:
- Industry norms (e.g., retail needs higher WC than manufacturing).
- Firm size (larger firms can afford more WC).
- Economic conditions (recessions → higher WC needs).
Example: A Nepalese bank (e.g., Global IME) holds higher WC than a Ncell store because banks must always have liquid assets to meet depositor withdrawals.
Too Little WC → Optimal WC → Too Much WC
| Insolvency Risk | Balanced | Wasted Capital |
Trade-off: Banks aim for liquidity safety; startups prioritize growth over safety.
In the Real World
eSewa/Khalti (Digital Payments):
- Idea: Cash flow forecasting ensures eSewa/Khalti can cover transaction volumes without running out of funds.
- How: Uses real-time analytics to predict peak payment times (e.g., salary days) and pre-position liquidity.
- Worked Example: On Baisakh 15, eSewa expects Rs 500 million in transactions. It borrows short-term from banks to cover the spike, then repays once funds clear.
Daraz (E-commerce):
- Idea: Inventory management (ABC analysis + EOQ) prevents stockouts during festivals (e.g., Dashain).
- How: Daraz stocks A-items (high-value, low-volume) in warehouses and C-items (bulk, low-value) near distribution centers.
- Worked Example: During Tihar, Daraz’s EOQ for firecrackers is 5,000 boxes (calculated based on past demand). If sales exceed, it orders additional stock via suppliers.
NTC/Ncell (Telecom):
- Idea: Accounts receivable management ensures timely collections from subscribers.
- How: NTC offers discounts for prepaid top-ups (e.g., 10% off on Rs 1,000 top-ups) to encourage early payments.
- Worked Example: A Ncell customer owes Rs 500. If paid within 7 days, they get a 5% discount (Rs 25 savings). This reduces Ncell’s receivables period from 30 to 7 days.
Exam Tip
This unit is highly numerical and tests:
Calculations: EOQ, CCC, working capital ratios, cash budgets.
- Example: You’ll see a balance sheet and be asked to compute NWC or CCC.
- Tip: Always round to 2 decimal places for ratios (e.g., 1.50, not 1.5).
Conceptual Questions: Differentiate short-term vs. long-term financing, explain trade-offs in credit policies, or analyze ABC analysis for a given scenario.
- Example: "Why does a retail store like Pathao need higher working capital than a manufacturing firm like Ncell?"
- Answer Structure:
- Pathao has higher receivables (customers pay post-delivery).
- Ncell has long-term contracts (prepaid plans reduce receivables risk).
- Key Point: Industry-specific needs determine WC levels.
Application-Based: Link theories to Nepali businesses (e.g., banks, e-commerce, telecom).
- Example: "How would eSewa use cash flow forecasting to handle a sudden Rs 2 billion transaction surge?"
- Answer:
- Step 1: Analyze historical data to predict peak periods (e.g., salary days).
- Step 2: Pre-borrow from banks or use liquidity lines of credit.
- Step 3: Optimize receivables by offering discounts for early payments.
Graphs/Tables: Expect working capital cycle diagrams, cash budget tables, or ratio analysis comparisons.
- Tip: Always label axes and unitize (e.g., "Days" for CCC, "Rs" for cash flows).
Final Advice:
- Memorize formulas (EOQ, CCC, ratios) but practice calculations—exams love numericals.
- Relate to Nepali examples (eSewa, Daraz, Ncell) to score higher.
- For essays, use real-world trade-offs (e.g., "Why does a startup like Pathao take trade credit but a bank like Global IME avoids it?").
Mermaid Diagram: Working Capital Cycle
flowchart TD
    A["Cash Outflow\n(Purchase Inventory)"] --> B["Inventory\n(Storage Costs)"]
    B --> C["Sales\n(Receivables Created)"]
    C --> D["Accounts Receivable\n(Collection Period)"]
    D --> E["Cash Inflow\n(Receivables Collected)"]
    E --> A
    text A "Days Payable Outstanding (DPO)"
    text D "Days Sales Outstanding (DSO)"
Based on the TU BBS syllabus for Fundamentals Of Corporate Finance (FIN250), unit 3.
Discussion
Loading…