Fundamentals Of InvestmentUnit 58 min read
Risk & Return: Portfolio Theory & CAPM
Unit 5 of Fundamentals Of Investment explores how investors balance risk and return using diversification, portfolio theory, and the Capital Asset Pricing Model (CAPM). Learn to calculate expected returns, betas, and optimal portfolios while analyzing real-world applications in Nepal’s stock market, mutual funds, and c
Core Concepts: Risk and Return
1. Risk and Return: The Trade-off
Investors always face a trade-off: higher returns come with higher risk. This is the foundation of modern portfolio theory.
Measuring Risk
Risk is typically measured using:
- Standard Deviation (σ): Measures the volatility of returns (how much returns fluctuate from the average).
- Variance (σ²): The square of standard deviation, used in calculations.
- Beta (β): Measures a stock’s sensitivity to market movements (how much it moves relative to the market).
Measuring Return
Return is calculated as: For example, if you buy a stock for Rs. 1,000, it grows to Rs. 1,200, and pays a Rs. 50 dividend, your return is:
2. Portfolio Theory: Diversification
Diversification reduces risk by combining assets with different risk profiles. The key idea is that a well-diversified portfolio can achieve higher returns with lower risk than individual stocks.
How Diversification Works
- Unsystematic Risk (Diversifiable Risk): Risk specific to a company or industry (e.g., a factory fire at a single company).
- Systematic Risk (Non-Diversifiable Risk): Market-wide risk (e.g., inflation, recessions) that affects all investments.
The Efficient Frontier
The Efficient Frontier is a graph showing the optimal portfolios that offer the highest expected return for a given level of risk. Portfolios on this frontier are considered "efficient" because no other portfolio offers a better return for the same risk.
graph TD
A["High Risk"] --> B["High Return"]
A --> C["Moderate Return"]
D["Low Risk"] --> C
D --> E["Low Return"]
C --> F["Efficient Frontier"]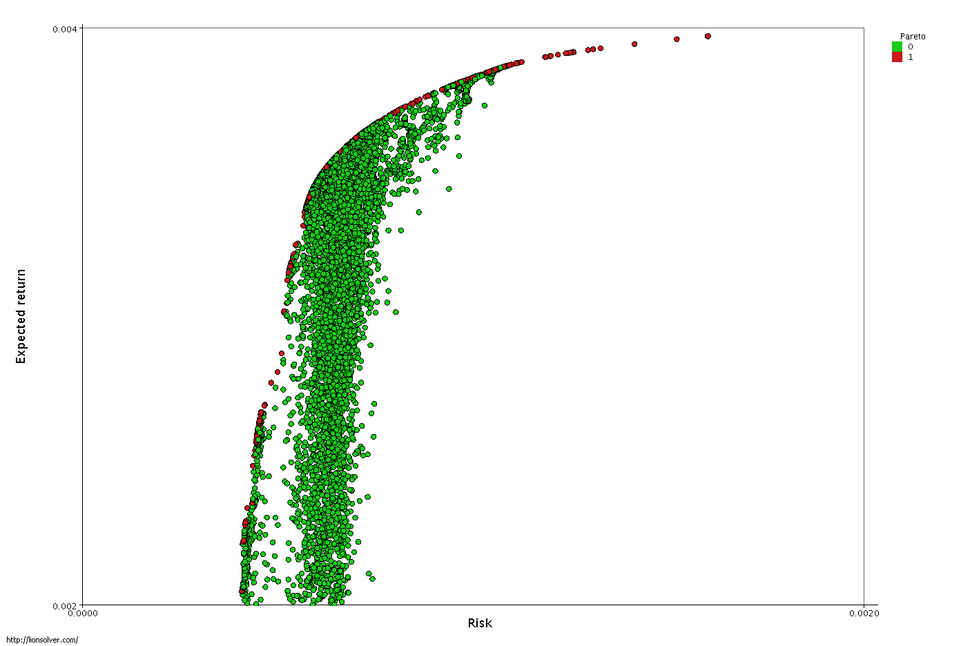 A graph showing the Efficient Frontier with risk (x-axis) and return (y-axis), highlighting how diversification moves portfolios toward the frontier. (Image: Marcuswikipedian, CC BY-SA 3.0, via Wikimedia Commons)
3. Capital Asset Pricing Model (CAPM)
CAPM is a model that describes the relationship between risk and expected return for assets, particularly stocks. It states that: Where:
- = Expected return of the asset
- = Risk-free rate (e.g., government bond yield)
- = Beta of the asset (sensitivity to market)
- = Expected return of the market
Interpreting Beta (β)
- β = 1: The stock moves with the market (average risk).
- β > 1: The stock is more volatile than the market (higher risk, higher potential return).
- β < 1: The stock is less volatile than the market (lower risk, lower potential return).
Example (CAPM Calculation):
- Risk-free rate () = 5%
- Market return () = 12%
- Stock beta () = 1.5 This means the stock’s expected return is 15.5%.
In the Real World
1. Nepal Stock Exchange (NEPSE) and Beta
- NEPSE Index: Many stocks listed on NEPSE have betas calculated based on their historical returns vs. the market. For example:
- Nabil Bank: Often has a beta > 1 (higher risk, higher return potential).
- Himalayan Bank: May have a beta < 1 (more stable, lower risk).
- Investors use CAPM to decide whether a stock is overpriced or underpriced. If a stock’s expected return (based on CAPM) is higher than its current market return, it may be a good buy.
2. Mutual Funds and Diversification
- NMB Mutual Funds, Global IME Mutual Funds: These funds hold diversified portfolios of stocks and bonds to reduce unsystematic risk. For example:
- A fund with β = 0.9 is less risky than the market but may offer slightly lower returns.
- A fund with β = 1.2 is riskier but aims for higher returns.
3. Khalti and E-Sewa: Risk in Digital Payments
- Beta-like Risk in Tech: While not directly using CAPM, platforms like Khalti and E-Sewa face systematic risks (e.g., government regulations, cybersecurity threats) and unsystematic risks (e.g., individual user fraud).
- Diversification Strategy: These companies invest in multiple payment methods (UPI, cards, mobile wallets) to spread risk.
Worked Example: CAPM in Nepal’s Stock Market
Scenario: You are analyzing Cement India Limited (CIL), a stock listed on NEPSE.
- Risk-free rate () = 6% (Nepal Treasury Bill yield)
- Market return () = 10% (NEPSE historical average)
- CIL’s beta () = 1.3 (from financial reports)
- Current market price of CIL = Rs. 1,200
- Expected dividend next year = Rs. 40
Step 1: Calculate Expected Return Using CAPM
Step 2: Compare with Current Yield If CIL’s current dividend yield is: But its total expected return (CAPM) is 11.2%, meaning investors expect capital gains to drive most of the return.
Decision: If the stock is trading below its fair value (based on CAPM), it may be a good investment.
Comparing Risk Measures
| Measure | Definition | Example (Nepal Context) | Use in CAPM? |
|---|---|---|---|
| Standard Deviation (σ) | Volatility of returns | NEPSE index σ = 20% (historical) | No |
| Beta (β) | Sensitivity to market movements | Nabil Bank β = 1.4 | Yes |
| Sharpe Ratio | Risk-adjusted return | Mutual Fund A: Sharpe = 0.8 | No (but useful) |
| Variance (σ²) | Squared standard deviation | Used in portfolio optimization | Indirectly |
Advantages and Disadvantages of Portfolio Theory and CAPM
Advantages
✅ Diversification reduces risk without sacrificing returns. ✅ CAPM provides a clear framework for valuing stocks. ✅ Helps investors make rational decisions based on risk tolerance.
Disadvantages
❌ Assumes markets are efficient (prices reflect all available information). ❌ Beta may not capture all risks (e.g., company-specific risks). ❌ Hard to estimate inputs (e.g., future market returns).
Exam Tip
What Examiners Look For
- Understand the CAPM formula and know how to rearrange it for different variables.
- Example: If asked to find beta, rearrange as:
- Differentiate between systematic and unsystematic risk.
- Systematic risk cannot be diversified away (e.g., inflation).
- Unsystematic risk can be reduced by diversification.
- Calculate expected returns and standard deviations from probability distributions.
- Interpret the Efficient Frontier and explain why portfolios on it are optimal.
- Apply CAPM to real-world scenarios (e.g., NEPSE stocks, mutual funds).
Common Mistakes to Avoid
❌ Ignoring the risk-free rate in CAPM calculations. ❌ Assuming beta is always >1 (some stocks have β < 1). ❌ Mixing up standard deviation and beta (they measure different types of risk). ❌ Not checking units (returns should be in decimals, e.g., 10% = 0.10).
Final Checklist Before the Exam
- Can I derive the CAPM formula from scratch?
- Do I know how to calculate beta from historical returns?
- Can I explain diversification using real examples (e.g., NEPSE vs. mutual funds)?
- Do I understand the difference between expected return and realized return?
- Can I plot a simple Efficient Frontier graph?
Based on the TU BBS syllabus for Fundamentals Of Investment (FIN253), unit 5.
Discussion
Loading…