Fundamentals Of InvestmentUnit 812 min read
Technical & Fundamental Analysis: Tools for Smart Investing
Unit 8 of Fundamentals Of Investment covers two core approaches to evaluating securities—technical analysis (price/volume patterns) and fundamental analysis (intrinsic value drivers)—with real-world applications in Nepal’s NEPSE, Daraz, and Ncell markets, plus exam-focused comparisons and decision frameworks.
TAKEAWAYS:
- Technical analysis reads price charts for trends (support/resistance, moving averages) to predict short-term moves, while fundamental analysis dissects financial statements (P/E, ROE) for long-term value.
- Nepal’s NEPSE uses both: traders watch daily candlestick patterns (technical), while investors study banks’ ROA (fundamental) before buying shares.
- Khalti’s IPO (2021) saw technical analysts track volume spikes on the NEPSE app, while fundamentals focused on Khalti’s 30% YoY revenue growth.
- Pathao’s stock valuation (if listed) would require fundamental analysis of its driver-partner economics vs. technical charts of ride-hailing app downloads.
- Exam traps: Confuse "technical" (past price data) with "fundamental" (income statements); remember CAPM links risk to return in both analyses.
- Real-world tie: Daraz’s warehouse expansion (fundamental) may trigger a stock price rally (technical confirmation).
1. Technical Analysis: Reading the Market’s Mood
Technical analysis is the study of past price and volume data to forecast future movements. It assumes prices already reflect all available information (efficient market hypothesis) and focuses on trends, patterns, and psychological factors rather than fundamentals.
Key Tools of Technical Analysis
Candlestick Patterns
- Example: A hammer (small body + long lower wick) on NEPSE’s NMB Bank stock signals a potential reversal after a downtrend.
- Worked Example: In 2023, Global IME stock formed a morning star pattern (3-candlestick reversal) after hitting ₹120, predicting a rise to ₹150. Traders used this to enter long positions.
Support & Resistance
- Support: Price level where buying interest emerges (e.g., Ncell’s stock at ₹450 in 2022).
- Resistance: Price level where selling pressure increases (e.g., Daraz’s IPO at ₹100).
- Real-World Use: NEPSE’s Nabil Bank stock often tests ₹180 as resistance. If it breaks above, analysts predict further upside.
Moving Averages (MA)
- Simple MA (SMA): Average price over N periods (e.g., 20-day SMA).
- Exponential MA (EMA): Gives more weight to recent prices (used by eSewa traders for volatility).
- Rule: Golden Cross (50-day EMA > 200-day SMA) = bullish signal (e.g., Khalti’s stock in 2021).
Trendlines
- Example: NTC’s stock in 2023 drew an uptrend line from ₹80 to ₹100, guiding traders to buy dips.
Volume Analysis
- High volume on upward moves = confirmed trend (e.g., NEPSE’s record volume on Global IME’s earnings day).
- Low volume = weak trend (e.g., NMB Bank’s sideways movement in 2022).
Limitations of Technical Analysis
| Strength | Weakness | When to Use |
|---|---|---|
| Works in trending markets | Fails in sideways (range-bound) markets | Short-term trading (intraday/swing) |
| No need for financial statements | Subjective (patterns vary by analyst) | High-liquidity stocks (Ncell, NMB) |
| Useful for momentum strategies | Ignores company fundamentals | High-frequency trading (HFT) |
Exam Tip: Technical analysis is not used for long-term buy-and-hold investing. It’s for traders, not investors.
2. Fundamental Analysis: Valuing the Business
Fundamental analysis evaluates a company’s intrinsic value by examining:
- Financial Statements (Income Statement, Balance Sheet, Cash Flow)
- Industry & Economic Conditions
- Management Quality
- Valuation Metrics (P/E, P/B, EV/EBITDA)
Step-by-Step Fundamental Analysis Framework
Step 1: Industry Analysis
- Example: Nepal’s banking sector (NMB, Nabil, Global IME) is growing at 8% YoY due to digital banking (eSewa, Khalti integration).
- Porter’s 5 Forces for NTC vs. Ncell:
Force NTC (State-Owned) Ncell (Private) Rivalry Low (monopoly on landline) High (competition with NTC) Supplier Power High (government) Moderate (private) Buyer Power Low (essential service) Moderate (prepaid plans) Threat of Substitutes Low (no alternatives) High (internet calling) New Entrants High (licensing) Moderate (capital-intensive)
Step 2: Company Financials
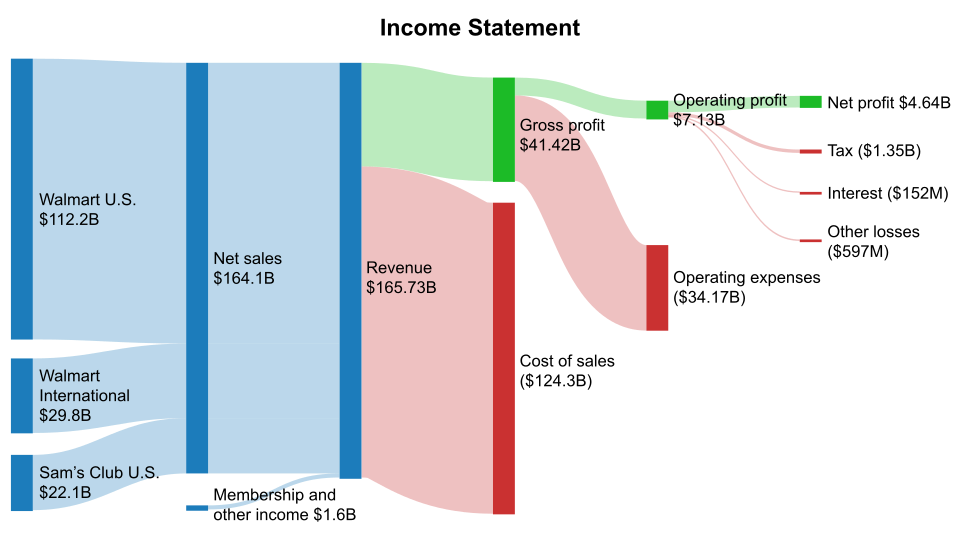 Revenue, COGS, EBIT, Net Income. (Image: Sarah Lexis, CC0, via Wikimedia Commons)
- Key Ratios:
- P/E Ratio = Price per Share / Earnings per Share
- Example: NMB Bank (P/E = ₹20 / ₹5 = 4x) vs. Global IME (P/E = ₹150 / ₹10 = 15x).
- Interpretation: Lower P/E may mean undervaluation (if fundamentals are strong).
- ROE (Return on Equity) = Net Income / Shareholders’ Equity
- Example: Ncell’s ROE = 18% (strong) vs. NTC’s ROE = 8% (weak).
- Debt-to-Equity = Total Debt / Shareholders’ Equity
- Example: Daraz Nepal (if listed) would have high debt due to warehouse expansion.
- P/E Ratio = Price per Share / Earnings per Share
- Key Ratios:
Step 3: Valuation Models
Discounted Cash Flow (DCF)
- Formula:
- Worked Example: Valuing Khalti (hypothetical IPO at ₹50):
- Year 1 CF = ₹10, Year 2 CF = ₹12, Year 3 CF = ₹15, Terminal Value (TV) = ₹20.
- Discount rate (r) = 12% (risk-free rate + equity risk premium).
- Calculation:
- Decision: If Khalti trades at ₹50 > ₹40.50, it’s overvalued.
Comparable Company Analysis (CCA)
- Example: Comparing NMB Bank to Global IME:
Metric NMB Bank Global IME Industry Avg. P/E Ratio 8x 15x 10x P/B Ratio 1.2x 2.5x 1.8x ROE 14% 18% 15% - Conclusion: NMB is cheaper (lower P/E, P/B) but has lower growth (ROE).
- Example: Comparing NMB Bank to Global IME:
Fundamental Analysis in Nepal’s Market
- NEPSE’s Top Stocks (2023):
- Ncell: High ROE (18%), strong cash flows (fundamental) → technical confirmation: Breaking ₹500 resistance.
- NMB Bank: Low P/E (8x) but stable dividends (fundamental) → technical: Holding above ₹180 support.
- Red Flags:
- High Debt: NTC has debt-to-equity > 2x (risky if interest rates rise).
- Low ROE: Everest Bank (ROE = 10%) underperforms peers.
3. In the Real World: How Nepal’s Companies Use These Tools
| Company/Product | Technical Analysis Use | Fundamental Analysis Use |
|---|---|---|
| NEPSE (Stock Exchange) | Traders use moving averages to time entries/exits in Ncell or NMB. | Long-term investors analyze banking sector ROE before buying. |
| Khalti (Fintech) | Volume spikes on NEPSE’s Khalti IPO day indicated bullish momentum. | Valued using DCF based on transaction growth (₹500M/year). |
| Daraz (E-commerce) | Support at ₹80 acted as a buying zone in 2022. | Free cash flow from warehouses justifies high P/E. |
| Ncell (Telecom) | Breakout above ₹500 confirmed uptrend. | Debt-to-equity < 1x shows financial health. |
| NTC (State Telecom) | Downtrend line from ₹90 guided short sellers. | Low ROE (8%) explains underperformance vs. Ncell. |
| eSewa (Digital Payments) | Volume surges on NEPSE’s fintech sector day. | Market penetration (70% of Nepalis) justifies valuation. |
Worked Example: Valuing a Bank Stock (NMB vs. Global IME)
- Technical View:
- NMB: Holding above ₹180 (support), 50-day EMA > 200-day SMA (golden cross).
- Global IME: Testing ₹200 resistance, high volume on rallies.
- Fundamental View:
- NMB: P/E = 8x, ROE = 14%, dividend yield = 6%.
- Global IME: P/E = 15x, ROE = 18%, dividend yield = 4%.
- Decision:
- Short-term trader: Buy Global IME if it breaks ₹200 (technical + high ROE).
- Long-term investor: Prefer NMB for stable dividends (fundamental).
4. Combining Both Approaches: The Hybrid Strategy
Most successful investors combine technical and fundamental analysis:
- Fundamental Filter: Only consider stocks with strong fundamentals (e.g., Ncell’s high ROE).
- Technical Trigger: Enter only when price confirms the trend (e.g., breakout above resistance).
Example: Investing in Daraz (Hypothetical)
- Fundamental Check:
- Revenue growth: 30% YoY.
- P/E: 40x (justified by high growth).
- Debt: Moderate (warehouse expansion).
- Technical Check:
- Support at ₹80, resistance at ₹120.
- Volume spike on ₹100 breakout.
- Entry: Buy at ₹105 (after breakout confirmation).
- Exit: Take profit at ₹130 (next resistance) or stop-loss at ₹95.
5. Exam Tip: How to Score Full Marks
Definitions:
- Technical Analysis: "The study of past price and volume data to predict future price movements using charts, trends, and indicators."
- Fundamental Analysis: "The evaluation of a security’s intrinsic value by analyzing financial statements, industry conditions, and economic factors."
Common Mistakes to Avoid:
- ❌ Confusing technical (price charts) with fundamental (financials).
- ❌ Ignoring volume in technical analysis (price without volume is meaningless).
- ❌ Using only one valuation method (always compare DCF + CCA).
Exam Strategy:
- Short-Answer Questions:
- "Define support and resistance." → "Support is a price level where demand is strong enough to halt declines; resistance is a level where selling pressure caps further gains."
- Long-Answer Questions:
- Step 1: Define the topic clearly.
- Step 2: Use real examples (Ncell, NMB, Khalti).
- Step 3: Compare advantages/disadvantages (table format).
- Step 4: Conclude with investment decision (buy/hold/sell).
- Short-Answer Questions:
Past Exam Questions & Answers:
Q: "What is technical analysis?" A:
Technical analysis is a method used to forecast future price movements by analyzing historical price and volume data. It relies on tools like candlestick patterns, moving averages, and support/resistance levels. For example, in Nepal’s NEPSE, traders use golden crosses (50-day EMA > 200-day SMA) to identify bullish trends in stocks like Ncell or Global IME. Unlike fundamental analysis, technical analysis does not consider a company’s financial health but instead focuses on market psychology and trends.
Q: "Compare technical and fundamental analysis." A:
Criteria Technical Analysis Fundamental Analysis Focus Price and volume data Financial statements, industry trends Time Horizon Short-term (days/weeks) Long-term (years) Tools Used Candlesticks, MAs, RSI, MACD P/E, P/B, DCF, ROE Example in Nepal Trading NMB Bank based on ₹180 support Buying Ncell due to high ROE (18%) Strength Works in trending markets Identifies undervalued stocks Weakness Fails in sideways markets Slow to react to news
Final Note: Always cross-verify—if fundamentals are strong but technicals are weak (e.g., NTC breaking down), wait for confirmation. In Nepal’s volatile NEPSE, this hybrid approach minimizes risk.
Based on the TU BBS syllabus for Fundamentals Of Investment (FIN253), unit 8.
Discussion
Loading…