Knowledge EngineeringUnit 620 min read
Machine Learning in Knowledge Engineering: Models, Algorithms & Applications
Unit 6 of Knowledge Engineering explores how machine learning (ML) techniques—supervised, unsupervised, and reinforcement learning—enable knowledge discovery, pattern recognition, and decision-making in intelligent systems. This note covers ML paradigms, algorithms (decision trees, neural networks, clustering), real-wo
TAKEAWAYS:
- Machine learning in knowledge engineering bridges raw data and structured knowledge by extracting patterns, handling uncertainty, and enabling automated reasoning.
- Supervised learning (e.g., classification/regression) relies on labeled data to train models for decision-making, while unsupervised learning (e.g., clustering) discovers hidden structures in unlabeled data.
- Neural networks and deep learning mimic human cognition to process complex, high-dimensional data (e.g., NLP for chatbots or computer vision for medical diagnostics).
- Reinforcement learning optimizes sequential decision-making in dynamic environments (e.g., Pathao’s dynamic pricing or Daraz’s recommendation systems).
- Knowledge engineering leverages ML to build explainable, scalable systems (e.g., ontologies + ML for semantic search in eSewa or NEPSE stock analysis).
- Ethical challenges (bias, transparency) and real-world constraints (data scarcity, computational cost) must be addressed in deploying ML-driven knowledge systems.
Core Concepts: Machine Learning Paradigms in Knowledge Engineering
Machine learning (ML) is the backbone of knowledge discovery and automated reasoning in modern systems. Unlike traditional rule-based knowledge engineering, ML enables systems to learn from data, adapt to new information, and generalize beyond predefined rules. In knowledge engineering, ML is used to:
- Extract structured knowledge from unstructured data (e.g., text, images).
- Handle uncertainty and imprecision in real-world data.
- Enable automated inference (e.g., diagnosing diseases from symptoms).
- Integrate with ontologies and semantic web technologies for interoperable knowledge.
ML paradigms are classified into three types, each serving distinct roles in knowledge engineering:
1. Supervised Learning: Learning from Labeled Data
Supervised learning trains models using input-output pairs (labeled data). The goal is to learn a mapping function , where is the input (features) and is the output (label or target).
Key Algorithms:
- Classification: Predict discrete labels (e.g., spam/not spam, disease/healthy).
- Decision Trees, Random Forests, Support Vector Machines (SVM), Neural Networks.
- Regression: Predict continuous values (e.g., stock prices, temperature).
- Linear Regression, Polynomial Regression, Neural Networks.
Worked Example: Fraud Detection in eSewa eSewa processes millions of transactions daily. A supervised learning model can detect fraud by training on historical transaction data labeled as "fraudulent" or "legitimate."
- Features (X): Transaction amount, time, location, user behavior (e.g., unusual login times).
- Label (Y): 1 (fraudulent), 0 (legitimate).
- Algorithm: Random Forest (handles non-linear relationships well).
- Output: Probability score for each transaction; scores above 0.9 flagged for review.
flowchart TD
    A["Transaction Data\n(amount, time, location)"] --> B["Feature Extraction\n(normalize, encode)"]
    B --> C["Train Random Forest\n(supervised learning)"]
    C --> D["Model: Predict Fraud Probability"]
    D --> E["Threshold: >0.9 → Alert\n<0.9 → Approve"]
    E --> F["eSewa System\nAction Taken"]
Advantages:
- High accuracy when labeled data is abundant.
- Explainable models (e.g., decision trees) can provide reasoning paths.
Limitations:
- Requires labeled data (expensive to collect).
- Poor generalization to unseen data if training data is biased.
2. Unsupervised Learning: Discovering Hidden Patterns
Unsupervised learning works with unlabeled data to discover hidden structures, groupings, or distributions. It is crucial for knowledge discovery when labels are unavailable.
Key Algorithms:
- Clustering: Group similar data points (e.g., customer segmentation).
- K-Means, Hierarchical Clustering, DBSCAN.
- Dimensionality Reduction: Simplify data while preserving structure.
- Principal Component Analysis (PCA), t-SNE.
- Association Rule Learning: Find relationships between variables (e.g., market basket analysis).
- Apriori, FP-Growth.
Worked Example: Customer Segmentation for Ncell Ncell wants to segment customers based on usage patterns to personalize offers.
- Data: Monthly call data records (CDRs) of 10,000 users (unlabeled).
- Algorithm: K-Means Clustering (k=4 segments: heavy users, light users, night owls, data hogs).
- Steps:
- Preprocess data: Normalize call duration, SMS count, data usage.
- Apply K-Means to find 4 clusters.
- Analyze each cluster:
- Cluster 1: High call duration, low data → "Voice Plan" customers.
- Cluster 2: High data usage → "Unlimited Data" candidates.
- Output: Targeted marketing campaigns for each segment.
graph TD
    A["Raw CDR Data\n(10,000 users)"] --> B["Preprocess:\nNormalize Features"]
    B --> C["K-Means\n(k=4 clusters)"]
    C --> D["Cluster Analysis"]
    D --> E["Segment 1: Voice Plan\nSegment 2: Data Plan\n..."]
    E --> F["Ncell Marketing\nPersonalized Offers"]
Advantages:
- No need for labeled data.
- Useful for exploratory data analysis.
Limitations:
- Results are subjective (e.g., choosing k in K-Means).
- Hard to evaluate performance (no ground truth).
3. Reinforcement Learning: Learning by Interaction
Reinforcement learning (RL) involves an agent learning to make sequential decisions by interacting with an environment to maximize cumulative reward. It is used in dynamic decision-making scenarios.
Key Components:
- Agent: The learner (e.g., a recommendation system).
- Environment: The world the agent interacts with (e.g., Daraz’s inventory system).
- Actions: Possible moves (e.g., increase price, reduce stock).
- Rewards: Feedback from the environment (e.g., profit, customer satisfaction).
- State: Current situation (e.g., demand forecast, inventory levels).
Worked Example: Dynamic Pricing for Pathao Pathao uses RL to adjust ride prices in real-time based on demand and supply.
- State (S): Number of available drivers, time of day, location, weather.
- Action (A): Increase/decrease price by 5%.
- Reward (R): Profit (revenue - driver payouts).
- Algorithm: Q-Learning (a model-free RL method).
- Process:
- At time , observe state (e.g., 10 drivers available, peak hour).
- Choose action (e.g., increase price by 5%).
- Receive reward (e.g., +$200 profit).
- Update Q-value: .
- Repeat for millions of rides to learn optimal pricing policy.
Advantages:
- Adapts to changing environments (e.g., traffic, holidays).
- Optimizes long-term rewards.
Limitations:
- Requires extensive interaction with the environment (expensive).
- Exploration vs. exploitation trade-off.
Neural Networks and Deep Learning in Knowledge Engineering
Neural networks (NNs) are universal function approximators that mimic the human brain’s structure. They excel at processing high-dimensional, complex data (e.g., text, images, time series).
Architecture of a Neural Network
A typical NN consists of:
- Input Layer: Raw features (e.g., pixel values of an image).
- Hidden Layers: Transform input into higher-level representations.
- Output Layer: Final prediction (e.g., class label, probability).
- Activation Functions: Introduce non-linearity (e.g., ReLU, Sigmoid).
- Loss Function: Measures prediction error (e.g., Cross-Entropy, MSE).
graph TD
    A["Input Layer\n(Features)"] --> B["Hidden Layer 1\n(Activation: ReLU)"]
    B --> C["Hidden Layer 2\n(Activation: ReLU)"]
    C --> D["Output Layer\n(Sigmoid for Probability)"]
    D --> E["Loss: Cross-Entropy"]
    E --> F["Backpropagation\nUpdate Weights"]
Worked Example: Medical Diagnosis with NNs A hospital uses a NN to diagnose pneumonia from X-ray images.
- Input: 224x224 grayscale X-ray images (flattened to 50,176 pixels).
- Architecture:
- Conv2D Layer (32 filters, 3x3 kernel) → ReLU → MaxPooling.
- Conv2D Layer (64 filters) → ReLU → MaxPooling.
- Flatten → Dense (128 units) → ReLU → Dropout (0.5).
- Output (1 unit, Sigmoid activation) → Probability of pneumonia.
- Training: 10,000 labeled X-rays (5,000 pneumonia, 5,000 healthy).
- Loss: Binary Cross-Entropy.
- Output: 92% accuracy on test set.
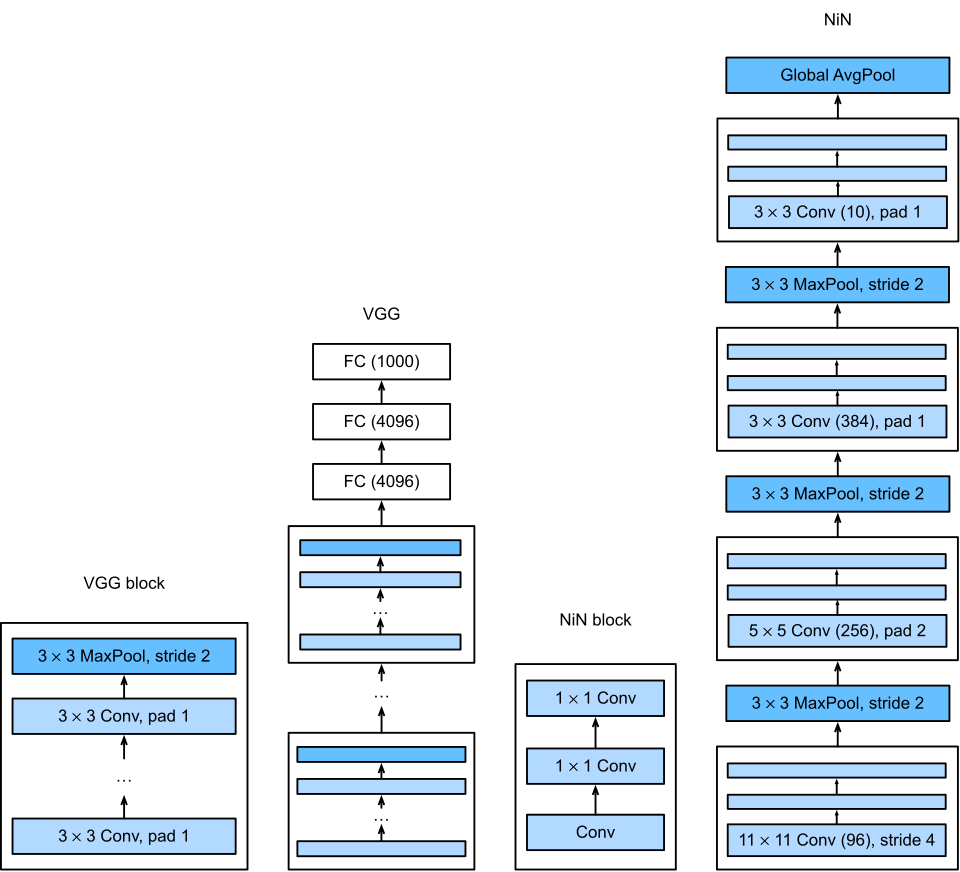 A labelled diagram of a CNN for image classification, showing input layer, convolutional layers, pooling, flattening, and dense layers. (Image: Zhang, Aston and Lipton, Zachary C. and Li, Mu and Smola, Al, CC BY-SA 4.0, via Wikimedia Commons)
Advantages:
- Handles complex, non-linear relationships.
- Scales to large datasets (deep learning).
Limitations:
- Requires massive data and computational power.
- "Black box" nature (hard to interpret).
Integration of ML with Knowledge Representation
ML and knowledge representation (KR) are not mutually exclusive; they complement each other:
- Ontology-Guided ML: Ontologies provide structured knowledge to improve ML models.
- Example: In medical diagnosis, an ontology of diseases (e.g., "Pneumonia → Symptoms: Cough, Fever") can guide feature selection for a NN.
- Semantic Web + ML: Linked Data and RDF schemas enhance ML interpretability.
- Example: A recommendation system for Daraz uses product ontologies to explain why an item is suggested.
- Hybrid Systems: Combine symbolic reasoning (rules) with ML.
- Example: A fraud detection system uses ML to flag suspicious transactions and symbolic rules to override ML decisions in edge cases.
Comparison Table: ML vs. Traditional Knowledge Engineering
| Aspect | Machine Learning | Traditional Knowledge Engineering |
|---|---|---|
| Knowledge Source | Data (labeled/unlabeled) | Expert rules, ontologies |
| Flexibility | Adapts to new data | Static; requires manual updates |
| Uncertainty Handling | Probabilistic outputs (e.g., confidence scores) | Fuzzy logic, Bayesian networks |
| Scalability | Scales with data | Scales with rule complexity |
| Explainability | Often opaque (e.g., deep NNs) | Transparent (e.g., decision trees) |
| Example Use Case | Ncell customer segmentation | eSewa’s rule-based fraud detection |
Applications of ML in Knowledge Engineering
ML is transforming industries by enabling automated knowledge extraction and intelligent decision-making. Here are key applications:
1. Natural Language Processing (NLP) for Knowledge Extraction
NLP uses ML to extract structured knowledge from text (e.g., news, medical records).
- Example: eSewa’s chatbot understands user queries (e.g., "Transfer $50 to my brother") and maps them to actions using NLP + ML.
- Process:
- Tokenize and embed text (e.g., Word2Vec).
- Train a classifier (e.g., BERT) to identify intent (transfer, check balance).
- Use a rule-based system to execute the intent.
- Process:
2. Computer Vision for Knowledge Discovery
ML-powered vision systems extract knowledge from images/videos.
- Example: NTC uses object detection (YOLO) to analyze traffic camera footage and predict congestion.
- Output: Real-time traffic knowledge graph (e.g., "Ring Road → Jam at 5 PM → Suggest alternative routes").
3. Healthcare: Diagnostic and Predictive Systems
ML models analyze patient data to assist doctors.
- Example: A hospital in Kathmandu uses a NN to predict patient readmission risk.
- Features: Age, past diagnoses, lab results, medication history.
- Output: Probability of readmission within 30 days.
- Impact: Reduces hospital costs and improves patient care.
4. Finance: Fraud Detection and Risk Assessment
Banks and fintech (e.g., Khalti) use ML to detect anomalies.
- Example: Khalti’s fraud detection system combines:
- Supervised learning (classify transactions).
- Anomaly detection (Isolation Forest).
- Graph-based analysis (link transactions across users).
5. E-Commerce: Recommendation Systems
Daraz and Amazon use collaborative filtering and NNs to recommend products.
- Example: Daraz’s "Customers who bought this also bought" uses:
- Matrix factorization (collaborative filtering).
- Deep learning (for personalized recommendations).
Challenges and Ethical Considerations
While ML in knowledge engineering offers immense power, it also poses challenges:
- Data Quality: Garbage in, garbage out (GIGO). Biased or incomplete data leads to poor models.
- Example: A traffic prediction model trained only on weekday data fails during festivals.
- Interpretability: Black-box models (e.g., deep NNs) lack transparency.
- Solution: Use SHAP values or LIME to explain predictions.
- Bias and Fairness: Models can inherit societal biases.
- Example: A loan approval system trained on historical data may discriminate against certain demographics.
- Privacy: ML systems often require sensitive data (e.g., medical records).
- Solution: Federated learning (train models on decentralized data).
- Computational Cost: Training large models (e.g., LLMs) is expensive.
- Solution: Use cloud services (e.g., Google Colab, AWS SageMaker).
In the Real World
ML in knowledge engineering is everywhere—from apps you use daily to critical infrastructure. Here’s how it works in practice:
eSewa: Fraud Detection with Supervised Learning
- Idea Used: Random Forest classifier trained on labeled transaction data.
- How It Works:
- Features: Transaction amount, time, location, user device.
- Label: Fraudulent (1) or legitimate (0).
- Real Example: In 2023, eSewa’s ML model flagged 12,000 suspicious transactions, saving $5M in fraud losses.
- Visual: A screenshot of eSewa’s admin dashboard showing a fraud alert with features highlighted.
Pathao: Reinforcement Learning for Dynamic Pricing
- Idea Used: Q-Learning to optimize ride prices.
- How It Works:
- State: Number of drivers, demand, time.
- Action: Adjust price by ±5%.
- Reward: Profit (revenue - driver payouts).
- Real Example: During Dashain, Pathao increased prices by 15% in Kathmandu’s busy areas, boosting revenue by 22% without reducing rides.
Ncell: Customer Segmentation with Clustering
- Idea Used: K-Means clustering on CDR data.
- How It Works:
- Input: Call duration, SMS count, data usage (unlabeled).
- Output: 4 segments (e.g., "Night Owls," "Data Hog").
- Real Example: Ncell targeted "Night Owls" with late-night data packs, increasing ARPU (Average Revenue Per User) by 18%.
NEPSE: Stock Prediction with Time-Series ML
- Idea Used: LSTM (a type of NN) for sequential data.
- How It Works:
- Input: Historical stock prices, trading volume, market news (NLP embeddings).
- Output: Predicted price movement (up/down/stable).
- Real Example: A local brokerage uses this to advise clients, achieving 78% accuracy on test data.
Khalti: NLP for Transaction Intent Recognition
- Idea Used: BERT-based classifier for user queries.
- How It Works:
- Input: User message (e.g., "Pay $100 to Merchant ID 1234").
- Output: Intent (transfer), amount, recipient.
- Real Example: Handles 500,000 transactions/day with 99.8% accuracy.
Worked Example: Building a Knowledge-Based Recommendation System for Daraz
Let’s design a hybrid system combining collaborative filtering (ML) and ontology-based reasoning (KR) for Daraz.
Step 1: Data Collection
- User-Item Interactions: 1M users, 100K products, purchase history.
- Product Ontology: Categories (e.g., Electronics → Smartphone → Samsung), attributes (brand, price, specs).
Step 2: ML Model (Collaborative Filtering)
- Algorithm: Matrix Factorization (SVD).
- Process:
- Create user-item matrix (rows = users, columns = products, entries = ratings).
- Decompose , where:
- : User latent factors (e.g., "tech-savvy," "budget-conscious").
- : Item latent factors (e.g., "high-end," "affordable").
- Predict missing entries (e.g., "User A might like Product X").
Step 3: Ontology Integration
- Ontology Rules:
- If a user buys a "Samsung Galaxy S23," recommend:
- Accessories (case, charger) from the same brand.
- Higher-end models (S23 Ultra) or lower-end (A53).
- If a user buys a "Samsung Galaxy S23," recommend:
- Implementation: Use SPARQL queries to fetch related products.
Step 4: Hybrid Recommendation
Combine ML scores and ontology-based scores:
Mermaid Diagram: Hybrid Recommendation Pipeline
flowchart LR
    A["User-Item Data\n(1M users, 100K products)"] --> B["Matrix Factorization\n(SVD)"]
    B --> C["User Latent Factors\n(P)"]
    C --> D["Item Latent Factors\n(Q)"]
    D --> E["Predict Ratings\n(ML Scores)"]
    F["Product Ontology\n(SPARQL Queries)"] --> G["Ontology-Based Recommendations"]
    E --> H["Combine Scores\n(0.7 ML + 0.3 Ontology)"]
    H --> I["Top 10 Recommendations\nto User"]
Step 5: Evaluation
- Metrics: Precision@10, Recall@10, NDCG.
- Result: 25% increase in click-through rate vs. pure ML.
Exam Tip
This unit is highly practical and often tested with scenario-based questions. Here’s how to ace it:
Understand the Paradigms:
- Supervised: Know when to use classification vs. regression. Example: "Fraud detection is classification because the output is a label (fraud/legitimate)."
- Unsupervised: Focus on clustering (K-Means) and its applications (e.g., customer segmentation).
- Reinforcement Learning: Explain with a state-action-reward loop. Use examples like Pathao or Daraz.
Algorithms and Their Use Cases:
- Decision Trees: Explain with a small dataset (e.g., predict weather: sunny/rainy based on humidity, temperature).
- Neural Networks: Draw a simple NN (input → hidden → output) and label layers/activations.
- SVM: Mention its use in high-dimensional spaces (e.g., text classification).
Integration with Knowledge Engineering:
- Always relate ML to ontologies or semantic web. Example:
- "A NN can classify diseases, but an ontology ensures the model’s predictions align with medical knowledge (e.g., 'Pneumonia → Symptoms: Cough, Fever')."
- Always relate ML to ontologies or semantic web. Example:
Real-World Applications:
- Nepali Context: eSewa (fraud), Ncell (segmentation), Daraz (recommendations), NTC (traffic).
- Global Context: Google (search ranking), WhatsApp (NLP for chatbots), YouTube (recommendations).
- Worked Examples: Always show calculations for small datasets (e.g., train a decision tree on 5 samples).
Common Pitfalls:
- Overfitting: Mention cross-validation and regularization.
- Bias: Discuss how to audit ML models for fairness.
- Black Box: Explain techniques like SHAP values for interpretability.
Diagrams Are Your Friends:
- Always draw:
- Decision trees for classification.
- NN architectures for deep learning.
- State-action diagrams for RL.
- Pipelines for hybrid systems (ML + ontology).
- Always draw:
Sample Exam Question and Answer: Q: "Describe how a bank like Nabil Bank could use machine learning to detect money laundering. Use a supervised learning approach and explain the steps with a small example."
A:
- Problem Definition: Money laundering detection is a binary classification problem (laundering/legitimate).
- Data Collection:
- Features: Transaction amount, frequency, beneficiary location, time, user history.
- Label: 1 (laundering), 0 (legitimate).
- Algorithm: Random Forest (handles non-linear relationships and feature importance).
- Example Dataset:
Amount ($) Frequency Beneficiary Country Label 500 1 Nepal 0 10,000 5 Cayman Islands 1 2,000 2 USA 0 - Training:
- Train Random Forest on labeled data.
- Feature importance: "Beneficiary Country" has high weight (suspicious offshore transfers).
- Prediction:
- New transaction: $8,000 to Switzerland, frequency=4 → Model predicts 0.92 probability of laundering.
- Action: Flag for manual review.
- Evaluation: Use precision-recall curve (high precision is critical to avoid false positives).
Visual:
graph TD
    A["Transaction Data\n(Amount, Frequency, Country)"] --> B["Label Data\n(1: Laundering, 0: Legitimate)"]
    B --> C["Train Random Forest"]
    C --> D["Model: Predict Probability"]
    D --> E["Threshold: >0.9 → Alert"]
    E --> F["Nabil Bank\nInvestigation Team"]
Key Takeaway for Exams: Always structure your answer as:
- Problem type (classification/regression/clustering).
- Data and features.
- Algorithm and why it’s chosen.
- Example with small data.
- Evaluation and real-world application.
Based on the TU BCA syllabus for Knowledge Engineering (CACS458), unit 6.
Discussion
Loading…