Fundamentals of Corporate FinanceUnit 712 min read
Capital Budgeting: NPV, IRR, Payback, PI, and Real-World Decisions
Unit 7 of Fundamentals of Corporate Finance covers how companies evaluate long-term investment projects using Net Present Value (NPV), Internal Rate of Return (IRR), Payback Period, Profitability Index (PI), and Discounted Payback Period, including their calculations, comparisons, and real-world applications in Nepali
What is Capital Budgeting?
Capital budgeting is the process by which a company evaluates long-term investment proposals (e.g., buying new machinery, expanding a factory, or launching a new product line) to determine whether they are worth pursuing. These decisions are critical because they involve large sums of money and have long-term implications for the company’s profitability and growth.
Key Questions Answered by Capital Budgeting
- Should we invest in this project?
- Which project among several options should we choose?
- How much should we invest?
- When will the investment generate enough cash flow to recover its cost?
Capital Budgeting Techniques
There are five primary techniques used to evaluate investment proposals. Each has its own strengths and weaknesses.
1. Net Present Value (NPV)
Definition: NPV is the difference between the present value of cash inflows and the present value of cash outflows over a project’s life. If NPV is positive, the project is acceptable; if negative, it is reject.
Formula: where:
- = Cash flow at time
- = Discount rate (cost of capital)
- = Initial investment
- = Project life
How It Works
- Discounts future cash flows to present value using the company’s cost of capital (minimum required return).
- Accounts for the time value of money (money today is worth more than money in the future).
- Considers all cash flows (not just accounting profits).
Example: Should Daraz Expand Its Warehouse?
Scenario: Daraz is considering expanding its warehouse in Kathmandu to handle increased demand. The expansion costs Rs. 50,000,000 and is expected to generate the following cash flows over 5 years:
| Year | Cash Flow (Rs.) |
|---|---|
| 0 | -50,000,000 |
| 1 | 15,000,000 |
| 2 | 18,000,000 |
| 3 | 20,000,000 |
| 4 | 12,000,000 |
| 5 | 8,000,000 |
Assumptions:
- Discount rate () = 12% (Daraz’s cost of capital).
- No salvage value at the end.
Calculation:
Decision: Since NPV > 0, Daraz should accept the warehouse expansion.
2. Internal Rate of Return (IRR)
Definition: IRR is the discount rate that makes NPV = 0. It represents the expected return on investment.
Formula:
(Usually calculated using Excel’s IRR function or financial calculators.)
How It Works
- Higher IRR = Better project (if IRR > cost of capital, accept).
- Does not consider the scale of investment (a small project with high IRR may not be better than a large one with slightly lower IRR).
- May have multiple IRRs if cash flows change signs more than once.
Example: Comparing Two Projects for Ncell
Ncell is evaluating two projects:
- Project A: Initial investment = Rs. 10,000,000; Cash flows = Rs. 3,000,000/year for 5 years.
- Project B: Initial investment = Rs. 20,000,000; Cash flows = Rs. 6,000,000/year for 5 years.
Calculating IRR (using Excel):
- Project A IRR = 12.75%
- Project B IRR = 12.75%
Problem: Both have the same IRR, but Project B requires twice the investment. NPV would help here.
3. Payback Period
Definition: The time it takes for a project to recover its initial investment from cash inflows.
Formula: For uneven cash flows, use cumulative cash flow analysis.
How It Works
- Shorter payback = Less risky (faster recovery of capital).
- Ignores cash flows after payback period (may reject profitable long-term projects).
- Does not consider time value of money (unlike NPV).
Example: Should a Kathmandu Restaurant Upgrade Its Kitchen?
Scenario: A restaurant in Kathmandu needs to upgrade its kitchen equipment for Rs. 2,000,000. Expected cash flows:
| Year | Cash Flow (Rs.) |
|---|---|
| 1 | 600,000 |
| 2 | 700,000 |
| 3 | 800,000 |
| 4 | 500,000 |
Calculation:
- Year 1: Rs. 600,000 (Remaining = 2,000,000 - 600,000 = 1,400,000)
- Year 2: Rs. 700,000 (Remaining = 1,400,000 - 700,000 = 700,000)
- Year 3: Rs. 800,000 (Recovers remaining Rs. 700,000 in 9 months)
Payback Period = 2 years + 9 months = 2.75 years
Decision: If the restaurant’s maximum acceptable payback period is 3 years, it should proceed.
4. Profitability Index (PI) or Benefit-Cost Ratio
Definition: PI measures the ratio of present value of cash inflows to the initial investment.
Formula:
How It Works
- PI > 1 = Accept (returns more than invested).
- PI < 1 = Reject (returns less than invested).
- Useful when capital is limited (rank projects by highest PI).
Example: Should a Bank in Nepal Fund a New Loan Product?
Scenario: A bank is considering two loan products:
| Project | Initial Investment (Rs.) | PV of Cash Flows (Rs.) | PI |
|---|---|---|---|
| Loan A | 5,000,000 | 6,000,000 | 1.2 |
| Loan B | 3,000,000 | 2,800,000 | 0.93 |
Decision:
- Loan A (PI = 1.2) > 1 → Accept
- Loan B (PI = 0.93) < 1 → Reject
5. Discounted Payback Period
Definition: Similar to payback period, but discounts cash flows to present value before calculating recovery time.
How It Works
- More accurate than regular payback (considers time value of money).
- Still ignores cash flows after payback.
Example: Should NEPSE Invest in a New Trading Terminal?
Scenario: NEPSE is evaluating a Rs. 10,000,000 investment with cash flows:
| Year | Cash Flow (Rs.) | PV (10% discount) |
|---|---|---|
| 1 | 3,000,000 | 2,727,273 |
| 2 | 4,000,000 | 3,305,785 |
| 3 | 5,000,000 | 3,703,704 |
Cumulative PV:
- Year 1: 2,727,273 (Remaining = 10,000,000 - 2,727,273 = 7,272,727)
- Year 2: 2,727,273 + 3,305,785 = 6,033,058 (Remaining = 7,272,727 - 6,033,058 = 1,239,669)
- Year 3: 6,033,058 + 3,703,704 = 9,736,762 (Recovers remaining in part of Year 3)
Discounted Payback Period ≈ 2.4 years
Decision: If NEPSE’s maximum acceptable payback is 3 years, it should invest.
Comparison of Capital Budgeting Techniques
| Technique | Considers Time Value of Money? | Considers All Cash Flows? | Best For... | Weaknesses |
|---|---|---|---|---|
| NPV | ✅ Yes | ✅ Yes | Best overall method | Requires discount rate |
| IRR | ✅ Yes | ✅ Yes | Ranking projects | May have multiple IRRs, ignores scale |
| Payback Period | ❌ No | ❌ No (stops at payback) | Quick screening, liquidity | Ignores TVM, cash flows after payback |
| PI | ✅ Yes | ✅ Yes | Capital-constrained decisions | Same issues as NPV |
| Discounted Payback | ✅ Yes | ❌ No (stops at payback) | More accurate than regular payback | Ignores cash flows after payback |
In the Real World
Daraz’s Warehouse Expansion
- NPV and IRR are used to decide whether expanding warehouses in Kathmandu or Pokhara is financially viable.
- Example: If Daraz’s cost of capital is 12% and a warehouse expansion has an NPV of Rs. 10 million, it will proceed.
Ncell’s 5G Network Investment
- NPV and PI help Ncell decide which regions to prioritize for 5G rollout.
- Example: If a 5G tower costs Rs. 50 million and generates Rs. 12 million/year in extra revenue, NPV at 10% discount rate may justify the investment.
Nepal Rastra Bank’s Loan Approvals
- Payback Period and IRR are used to assess loan applications.
- Example: A bank may reject a loan if the payback period exceeds 5 years, even if IRR is high.
Pathao’s Ride-Hailing Expansion
- Discounted Payback Period helps Pathao decide when to expand to new cities like Biratnagar or Dharan.
- Example: If a new city requires Rs. 20 million and recovers the investment in 3.5 years (discounted), it may proceed.
NEPSE’s Trading Terminal Upgrades
- NPV and PI are used to evaluate whether upgrading trading terminals improves efficiency.
- Example: If a Rs. 10 million upgrade increases trading volume by 20%, NPV analysis will determine if it’s worth it.
The Accounting Cycle of Capital Budgeting (Mermaid Diagram)
flowchart TD
    A["Project Proposal"] --> B["Estimate Cash Flows"]
    B --> C["Choose Evaluation Method\n(NPV, IRR, Payback, PI)"]
    C --> D["Calculate NPV/IRR/Payback/PI"]
    D --> E{"NPV > 0 or IRR > Cost of Capital?"}
    E -->|"Yes"| F["Accept Project"]
    E -->|"No"| G["Reject Project"]
    F --> H["Implement Project"]
    G --> I["Search for Better Alternatives"]
    H --> J["Monitor Performance"]
Exam Tip
- NPV is the most reliable method – Always prefer it over IRR unless asked otherwise.
- IRR can be misleading – If two projects have the same IRR but different NPVs, choose the one with higher NPV.
- Payback is simple but limited – Use it for quick screening, but NPV/IRR are better for final decisions.
- PI is useful for ranking projects when capital is limited.
- Always show calculations – Even if you use Excel, write down the formula and logic in exams.
- Watch for mutually exclusive projects – If two projects cannot be done together, choose the one with higher NPV.
- Inflation and taxes matter – If given, adjust cash flows for inflation and taxes before discounting.
- Real-world examples score extra marks – Relate answers to Nepali businesses (Daraz, Ncell, banks, NEPSE).
Practice Questions (With Solutions)
Question 1: NPV Calculation
A company is considering a project with:
- Initial cost = Rs. 1,000,000
- Cash flows: Rs. 300,000/year for 4 years
- Discount rate = 10%
Solution: Decision: Accept (NPV > 0).
Question 2: IRR vs. NPV Conflict
Two projects:
- Project X: NPV = Rs. 50,000, IRR = 15%
- Project Y: NPV = Rs. 40,000, IRR = 16%
Which to choose if capital is unlimited? Answer: Project X (higher NPV is better, even if IRR is slightly lower).
Question 3: Payback Period
A project costs Rs. 800,000 with cash flows:
- Year 1: Rs. 200,000
- Year 2: Rs. 300,000
- Year 3: Rs. 400,000
Solution:
- Year 1: 200,000 (Remaining = 600,000)
- Year 2: 300,000 (Remaining = 300,000)
- Year 3: 400,000 (Recovers remaining in 0.75 years)
Payback Period = 2.75 years
Final Summary
| Technique | When to Use | Key Advantage | Key Limitation |
|---|---|---|---|
| NPV | Best overall method | Considers all cash flows, TVM | Requires discount rate |
| IRR | Ranking projects | Easy to understand | May have multiple IRRs, ignores scale |
| Payback | Quick screening | Simple, liquidity focus | Ignores TVM, cash flows after payback |
| PI | Capital constraints | Ranks projects efficiently | Same as NPV |
| Discounted Payback | More accurate than payback | Considers TVM | Ignores cash flows after payback |
Remember:
- NPV > 0 → Accept
- IRR > Cost of Capital → Accept
- Payback ≤ Company’s threshold → Accept
- PI > 1 → Accept
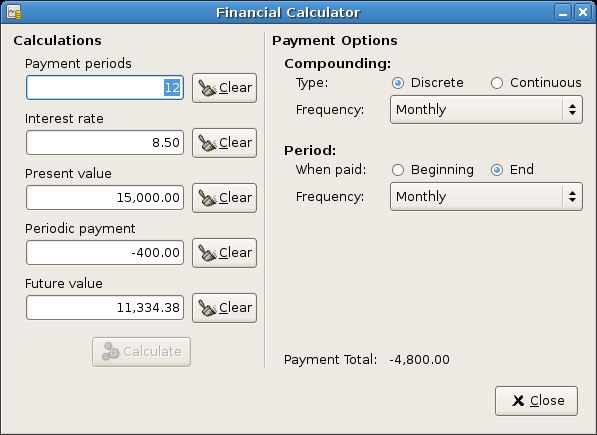 A typical financial calculator used for NPV, IRR, and payback calculations. (Image: GPL, via Wikimedia Commons)
Based on the TU BIM syllabus for Fundamentals of Corporate Finance (FIN229), unit 7.
Discussion
Loading…