Fundamentals of Corporate FinanceUnit 48 min read
Risk and Return: Measuring, Comparing, and Managing Trade-offs
Unit 4 of Fundamentals of Corporate Finance explores how investors and firms balance risk and return, covering key concepts like risk measurement (standard deviation, beta), risk-return trade-off, portfolio theory, and real-world applications in Nepalese and global markets.
Key Concepts and Definitions
1. Risk and Return: The Core Trade-off
Risk and return are inversely related: higher potential returns come with higher risk. Investors demand compensation for taking on risk. This trade-off is fundamental in finance and guides investment decisions.
2. Measures of Risk
Risk can be measured in different ways, depending on the context:
- Standard Deviation (σ): Measures the volatility of an asset's returns. Higher standard deviation means higher risk.
- Variance: The square of standard deviation, representing the spread of returns.
- Beta (β): Measures an asset's sensitivity to market movements. A beta > 1 means the asset is more volatile than the market; β < 1 means less volatile.
3. Measures of Return
Return is typically measured as:
- Arithmetic Mean Return: Simple average of returns over a period.
- Geometric Mean Return: Accounts for compounding and is more accurate for long-term investments.
- Holding Period Return (HPR): Total return over a specific investment period.
4. Risk-Return Trade-off
Investors prefer portfolios that offer the highest return for a given level of risk. The Efficient Frontier (from portfolio theory) represents the optimal combination of risk and return.
5. Portfolio Theory and Diversification
- Diversification: Spreading investments across assets to reduce risk (unsystematic risk).
- Systematic Risk: Market-wide risk that cannot be diversified away (e.g., inflation, recessions).
- Unsystematic Risk: Asset-specific risk that can be diversified (e.g., company-specific news).
6. Capital Asset Pricing Model (CAPM)
CAPM links risk and return by stating that an asset's expected return depends on:
- Risk-free rate (Rf)
- Market risk premium (Rm - Rf)
- Asset's beta (β)
The formula:
Visualizing Risk and Return
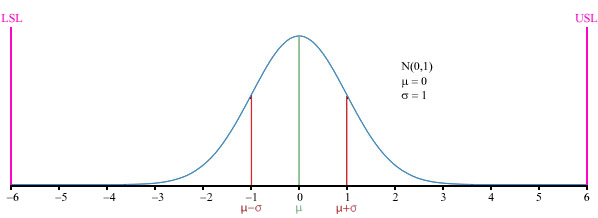
1. Standard Deviation and Normal Distribution
Standard deviation measures how returns deviate from the mean. A higher standard deviation means returns are more spread out, indicating higher risk.
2. Risk-Return Trade-off Graph
The graph below shows how investors balance risk (x-axis) and return (y-axis). Points on the Efficient Frontier are optimal portfolios.
graph TD
    A["High Risk"] --> B["High Return"]
    C["Low Risk"] --> D["Low Return"]
    E["Efficient Frontier"] -->|"Optimal Portfolios"| F["Balanced Risk-Return"]
    G["Risk-Free Asset"] --> H["Lowest Risk, Lowest Return"]
3. Portfolio Diversification
Diversification reduces unsystematic risk. The graph below shows how combining assets (e.g., stocks and bonds) can lower overall portfolio risk.
Worked Example: Risk and Return in a Nepali Investment Scenario
Scenario: Investing in NEPSE Stocks
Suppose you are considering two stocks in Nepal:
- Nabil Bank Ltd. (β = 1.2)
- Nepal Electricity Authority (NEA) (β = 0.8)
Given:
- Risk-free rate (Rf) = 6%
- Market return (Rm) = 12%
Step 1: Calculate Expected Returns Using CAPM
Using the CAPM formula:
For Nabil Bank:
For NEA:
Step 2: Interpret the Results
- Nabil Bank has a higher expected return (13.2%) but also higher risk (β = 1.2).
- NEA has a lower expected return (10.8%) but is less risky (β = 0.8).
Step 3: Diversification Decision
If you invest in both stocks, your portfolio's risk depends on their correlation. If the stocks are negatively correlated, your portfolio risk may be lower than investing in either alone.
Comparison Table: Risk Measures
| Measure | Definition | Use Case | Example |
|---|---|---|---|
| Standard Deviation | Measures volatility of returns. | Comparing individual stocks. | A stock with σ = 20% is riskier than one with σ = 10%. |
| Beta (β) | Measures sensitivity to market risk. | Assessing stock risk relative to the market. | A β of 1.5 means the stock is 50% more volatile than the market. |
| Variance | Square of standard deviation. | Statistical analysis of returns. | Used in portfolio optimization. |
| CAPM | Links risk and expected return. | Valuing stocks and setting expectations. | Used by investors to compare stocks. |
In the Real World
1. eSewa and Risk Management
eSewa, Nepal’s leading digital payment platform, faces systematic risk from market fluctuations (e.g., inflation, interest rates) and unsystematic risk from cybersecurity threats or regulatory changes. To manage risk:
- Diversification: eSewa partners with multiple banks and financial institutions to spread risk.
- Beta Analysis: eSewa’s stock (if listed) would be analyzed for its beta to determine its risk relative to the NEPSE index.
2. Ncell’s Capital Structure and Risk
Ncell, Nepal’s largest telecom operator, uses CAPM to determine the cost of equity for its projects. For example:
- If Ncell’s beta is 1.3 and the risk-free rate is 6%, while the market return is 10%, its cost of equity would be: This helps Ncell decide whether to invest in 5G expansion or other ventures.
3. Daraz’s Inventory and Working Capital Risk
Daraz, Nepal’s largest e-commerce platform, manages unsystematic risk by diversifying its supplier base. For example:
- If Daraz holds excess inventory of electronics, it faces liquidity risk (unable to sell quickly).
- To mitigate this, Daraz uses portfolio theory by balancing high-demand and low-demand products to optimize cash flow.
Exam Tip
- Understand CAPM: Be able to calculate expected returns using CAPM. Examiners often test this with numerical problems.
- Differentiate Risk Types: Know the difference between systematic and unsystematic risk, and how diversification affects them.
- Graph Interpretation: Be prepared to interpret risk-return graphs, including the Efficient Frontier.
- Real-World Applications: Relate concepts to Nepali companies (e.g., NEPSE stocks, banks, e-commerce platforms).
- Standard Deviation vs. Beta: Know when to use each measure—standard deviation for individual assets, beta for market-related risk.
Final Summary Table: Key Takeaways
| Concept | Key Idea | Exam Focus |
|---|---|---|
| Risk-Return Trade-off | Higher risk → Higher potential return. | Numerical problems, graph interpretation. |
| Standard Deviation | Measures volatility of returns. | Calculations, comparisons. |
| Beta (β) | Measures market sensitivity. | CAPM applications. |
| CAPM | Derivations, real-world examples. | |
| Diversification | Reduces unsystematic risk. | Portfolio theory questions. |
| Systematic vs. Unsystematic Risk | Systematic cannot be diversified; unsystematic can. | Definitions, applications. |
Based on the TU BIM syllabus for Fundamentals of Corporate Finance (FIN229), unit 4.
Discussion
Loading…