Multimedia System ApplicationUnit 36 min read
Images & Graphics: Types, Formats, Compression & Applications
Unit 3 of Multimedia System Application explores raster vs. vector graphics, image file formats (JPEG, PNG, SVG), color models (RGB, CMYK), resolution, compression techniques (lossy/lossless), and real-world applications in apps like eSewa, Daraz, and NEPSE. Includes worked examples on image optimization for web and pr
Core Concepts: What Are Images and Graphics?
1. Definitions
- Image: A visual representation of objects, scenes, or concepts captured by devices (cameras, scanners) or created digitally. Includes photographs, illustrations, and icons.
- Graphics: Artificially created visual elements (logos, diagrams, animations) using software tools (Adobe Illustrator, Photoshop).
- Multimedia Graphics: Combination of images, text, and animations to convey information interactively (e.g., infographics, UI elements).
2. Types of Graphics
A. Raster Graphics (Bitmap)
- Made of pixels (tiny colored dots) arranged in a grid.
- Resolution-dependent: Scaling up causes pixelation (blurriness).
- Best for: Photographs, digital paintings, complex textures.
- Example: A scanned document or a photo from your smartphone.
B. Vector Graphics
- Made of mathematical paths (lines, curves, shapes) defined by points and equations.
- Resolution-independent: Scales perfectly without quality loss.
- Best for: Logos, icons, typography, diagrams.
- Example: The Daraz logo or the Ncell logo.
mindmap
  root((Graphics Types))
    Raster
      Pixels
      Resolution-dependent
      Examples: Photos, Paintings
    Vector
      Mathematical Paths
      Resolution-independent
      Examples: Logos, Icons
In the Real World
- eSewa App: Uses vector graphics for its clean, scalable icons (e.g., payment buttons) and raster images for user photos (ID verification).
- Daraz Website: Optimizes JPEG compression for product images to reduce loading time while maintaining quality.
- NEPSE Stock Charts: Uses vector-based line graphs for smooth, scalable stock price trends (no pixelation when zoomed).
3. Image File Formats: How They Work
A. Raster Formats
| Format | Extension | Color Depth | Compression | Use Case | Example (Nepal) |
|---|---|---|---|---|---|
| JPEG | .jpg |
24-bit | Lossy | Photos, web images | Daraz product photos |
| PNG | .png |
24/32-bit | Lossless | Transparent images, logos | eSewa app icons |
| GIF | .gif |
8-bit | Lossless | Simple animations, memes | WhatsApp status animations |
| BMP | .bmp |
24/32-bit | Uncompressed | High-quality prints | Scanned documents |
Worked Example: Optimizing a Daraz Product Image
- Original: 5 MB (uncompressed).
- JPEG (90% quality): 1.2 MB (lossy, slight quality loss).
- PNG (transparency): 2.5 MB (lossless, for overlay text).
- Best choice: JPEG for web (faster load) or PNG for logos.
B. Vector Formats
| Format | Extension | Scalability | Use Case | Example (Nepal) |
|---|---|---|---|---|
| SVG | .svg |
Infinite | Logos, icons, infographics | Ncell logo |
| AI | .ai |
Infinite | Professional vector editing | Adobe Illustrator files |
| EPS | .eps |
Infinite | Print design | Bank logos (e.g., NMB) |
 Shows pixelation in raster vs. smooth scaling in vector. (Image: TU Wien: Dirk Praetorius, Michele Ruggeri, Public domain, via Wikimedia Commons)
4. Color Models: How Colors Are Represented
A. RGB (Red, Green, Blue)
- Additive model: Used in digital screens (monitors, phones).
- Range: 0–255 per channel (0 = black, 255 = full color).
- Example: Your smartphone display uses RGB.
B. CMYK (Cyan, Magenta, Yellow, Key/Black)
- Subtractive model: Used in printing (ink absorbs light).
- Range: 0–100% per channel.
- Example: NEPSE annual reports (printed brochures).
pie
  title Color Models
  "RGB (Digital)" : 50
  "CMYK (Print)" : 50
5. Resolution and DPI/PPI
- Resolution: Number of pixels (e.g., 1920×1080 for Full HD).
- DPI (Dots Per Inch): For printed images (e.g., 300 DPI for high-quality prints).
- PPI (Pixels Per Inch): For digital screens (e.g., 72–300 PPI for web).
- Rule of Thumb:
- Web: 72–150 PPI (faster loading).
- Print: 300 DPI (sharp text/images).
Worked Example: Printing a Kathmandu Traffic Map
- Low resolution (72 PPI): Blurry text, unreadable signs.
- High resolution (300 DPI): Clear details for posters.
6. Image Compression: Reducing File Size
A. Lossless Compression
- No quality loss: Original data is fully recoverable.
- Methods: PNG, GIF, ZIP.
- Best for: Logos, diagrams, text-heavy images.
B. Lossy Compression
- Quality loss: Removes redundant data (e.g., similar colors).
- Methods: JPEG, MP3 (audio).
- Best for: Photos, where minor quality loss is acceptable.
Comparison Table:
| Type | Quality Loss | File Size | Use Case |
|---|---|---|---|
| Lossless | None | Larger | Logos, documents |
| Lossy | Yes | Smaller | Photos, web images |
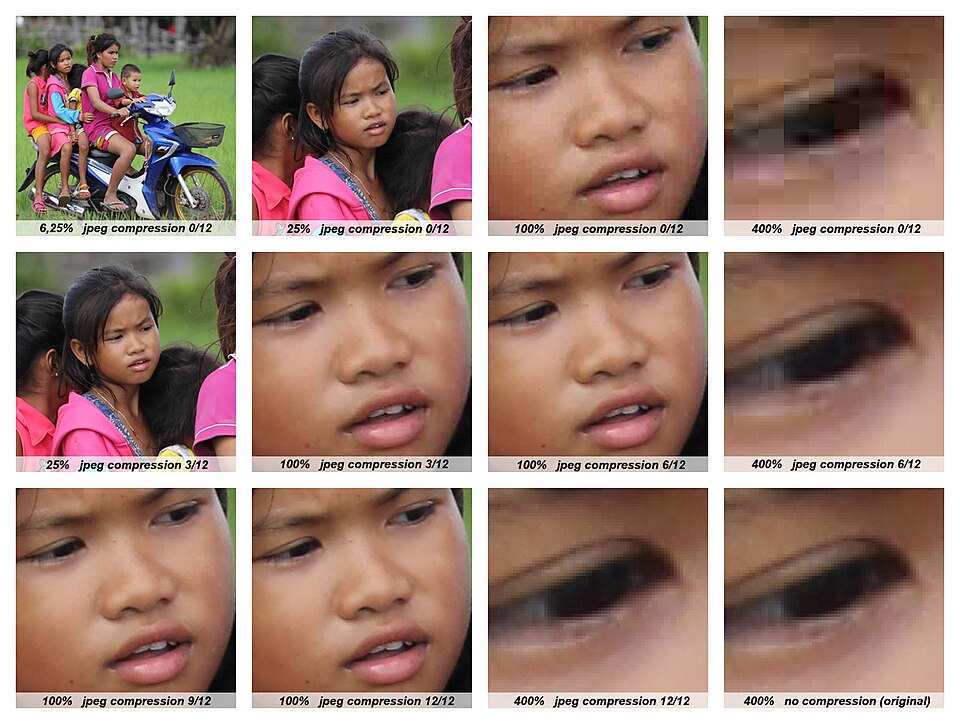 Shows how lossy compression removes details. (Image: Basile Morin, CC BY-SA 4.0, via Wikimedia Commons)
7. Applications in Nepal
- eSewa: Uses PNG for icons (transparency) and JPEG for user photos (smaller size).
- Daraz: Compresses product images to JPEG for faster loading.
- NEPSE: Uses SVG for stock charts (scalable without pixelation).
- Pathao: Optimizes GIFs for ride animations (low file size).
Exam Tip
- Remember: Raster = pixels (photos), Vector = math (logos).
- Format questions: Know when to use JPEG (photos) vs. PNG (logos).
- Color models: RGB for screens, CMYK for print.
- Resolution: 72 PPI for web, 300 DPI for print.
- Compression: Lossy for photos, lossless for logos.
- Real-world tie: Always relate to apps like eSewa, Daraz, or NEPSE in answers.
Summary Checklist: ✅ Can you distinguish raster vs. vector? ✅ Do you know when to use JPEG vs. PNG? ✅ Can you explain RGB vs. CMYK? ✅ How would you optimize an image for a website vs. a poster?
Based on the TU BIM syllabus for Multimedia System Application (IT273), unit 3.
Discussion
Loading…