Principles of ManagementUnit 810 min read
Communication & Control: Models, Barriers & Systems
Unit 8 of Principles of Management dissects how managers exchange information (communication) and regulate performance (control), with real-world ties to Nepal’s eSewa, NTC, and Daraz—plus exam-ready models like the control cycle and barriers to communication.
TAKEAWAYS:
- Communication is a two-way process with 7 key elements (sender → message → receiver) and barriers (language, noise, filters) that distort it.
- Control systems use feedback loops (e.g., NTC’s call-drop reports) to compare performance vs. standards and correct deviations.
- Financial control (budgets, audits) and information control (KPIs, dashboards) are tools managers use to align operations with goals.
- Men vs. women communication styles differ in directness (task-focused vs. relationship-focused) and impact conflict resolution.
- The control process (set standards → measure → compare → correct) is cyclical, like Daraz’s inventory turnover checks.
- Effective control systems are flexible, accurate, and timely—just as Ncell adjusts network coverage based on real-time data.
1. Communication: The Foundation of Management
Communication is the lifeblood of organizations, enabling coordination, decision-making, and motivation. It involves encoding (sender’s message), transmission (medium), and decoding (receiver’s interpretation).
The Communication Process
flowchart TD
    A["Sender"] -->|"Message"| B["Encoding"]
    B -->|"Signal"| C["Medium"]
    C -->|"Noise"| D["Decoding"]
    D -->|"Feedback"| E["Receiver"]
    E -->|"Response"| A
Key Elements:
- Sender: Initiates the message (e.g., a manager at NTC).
- Encoding: Converts ideas into symbols (verbal, written, visual).
- Medium: Channel (email, meeting, WhatsApp).
- Decoding: Receiver interprets the message (e.g., an employee at Ncell).
- Feedback: Confirmation of understanding (e.g., "Got it!").
- Noise: Distractions (language barriers, technical glitches).
- Context: Situation (formal/informal, culture).
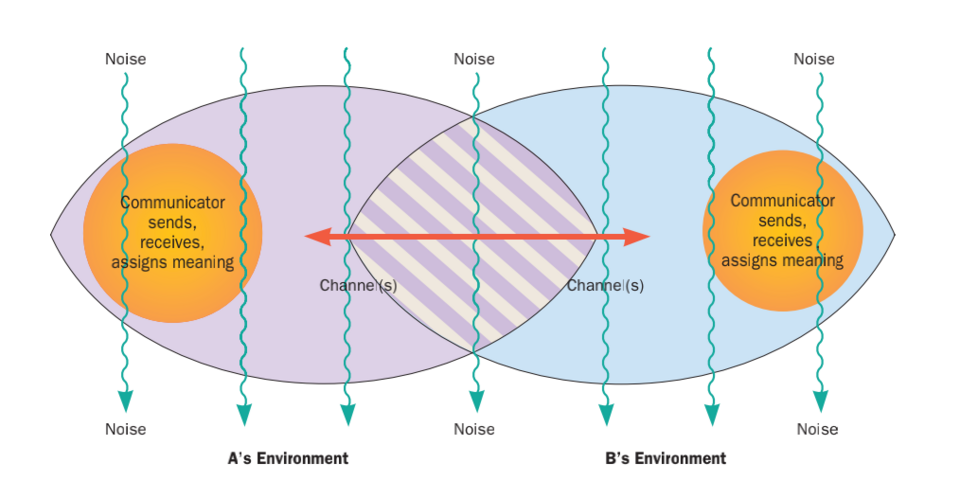 communication process diagram (Image: Adler, Ronald B., CC BY-SA 4.0, via Wikimedia Commons)
| A flowchart showing sender → encoding → medium → decoding → feedback with noise as a disruptor.
communication process diagram (Image: Adler, Ronald B., CC BY-SA 4.0, via Wikimedia Commons)
| A flowchart showing sender → encoding → medium → decoding → feedback with noise as a disruptor.
Barriers to Effective Communication
| Type | Example | Impact |
|---|---|---|
| Semantic | Jargon (e.g., "synergy" at a bank) | Confusion, misalignment |
| Physical | Poor acoustics in a meeting | Distorted messages |
| Psychological | Fear of boss (e.g., employee silence) | Withheld feedback |
| Organizational | Hierarchy (e.g., NTC’s layers) | Delayed information flow |
| Cultural | Nepali vs. English communication | Misunderstandings in teams |
Worked Example: eSewa’s Customer Support
- Problem: Users report payment failures.
- Sender: Customer → eSewa support (WhatsApp).
- Barrier: Technical noise (server downtime).
- Solution: eSewa’s feedback loop (automated replies + human agents) reduces delays.
Men vs. Women Communication Styles
mindmap
  root((Communication Styles))
    Men
      - Task-focused
      - Direct ("Let’s solve this.")
      - Competitive (e.g., sales teams)
    Women
      - Relationship-focused
      - Indirect ("How are you feeling about this?")
      - Collaborative (e.g., team meetings)
    Nepali Context
      - Respect hierarchy (e.g., elders first)
      - Politeness (e.g., "Please explain again")
Updated to include Nepali communication nuances. Exam Tip: Use real-world examples (e.g., "In Pathao’s driver coordination, women often use indirect hints to avoid conflict").
2. Control: Aligning Performance with Goals
Control ensures planned results are achieved by comparing actual performance with standards. It’s the "steering wheel" of management.
The Control Process (Cycle)
flowchart TD
    A["Set Standards"] --> B["Measure Performance"]
    B --> C["Compare with Standards"]
    C --> D["Take Corrective Action"]
    D --> A
Steps Explained:
- Set Standards: Goals (e.g., NTC’s 99% call success rate).
- Measure Performance: Data collection (e.g., call-drop analytics).
- Compare: Deviations identified (e.g., 3% drop in rural areas).
- Correct: Action taken (e.g., tower upgrades in Chitwan).
| A circular flowchart with arrows: Standards → Measure → Compare → Correct → Standards.
Types of Control
| Type | Example | Tools Used |
|---|---|---|
| Financial | Bank audits, budget tracking | Budgets, variance analysis |
| Information | Daraz’s sales dashboards | KPIs, reports |
| Physical | Factory quality checks | Inspections, checklists |
| Human Resources | Employee performance reviews | 360-degree feedback |
Worked Example: Ncell’s Network Control
- Standard: 95% network uptime.
- Measurement: Real-time monitoring tools.
- Deviation: 12% downtime in Kathmandu.
- Action: Upgrade towers in Thapathali.
Qualities of an Effective Control System
Why It Matters: A rigid system (e.g., Nabil Bank’s outdated loan approval) fails to adapt to market shifts.
3. Financial Control: Numbers That Drive Decisions
Financial control ensures resources are used efficiently. Key methods:
Budgetary Control
- Example: Daraz’s monthly sales budget vs. actual sales.
- Tools:
- Flexible budgets: Adjust for seasonality (e.g., Dashain sales).
- Zero-based budgeting: Justify every expense (used in government projects).
Variance Analysis
| Type | Formula | Example |
|---|---|---|
| Favorable | Actual > Budget | Daraz sells 10% more than planned. |
| Unfavorable | Actual < Budget | NTC’s data costs exceed budget. |
| A table with columns: Actual, Budget, Variance (Favorable/Unfavorable), and a Daraz example.
Tools of Financial Control
- Ratio Analysis: Profitability (e.g., NEPSE’s P/E ratio).
- Break-even Analysis: Himalayan Java’s coffee sales volume to cover costs.
- Audits: Independent checks (e.g., NAB’s bank inspections).
Real-World Tie: Nabil Bank’s Loan Control
- Standard: 90% loan repayment rate.
- Control: Monthly repayment tracking + default alerts.
- Action: Offer refinancing to struggling borrowers.
4. Information Control: Data as a Decision-Maker
Information control ensures right data reaches the right people. Example: KPIs (Key Performance Indicators).
KPIs in Action
| Organization | KPI | Why It Matters |
|---|---|---|
| Pathao | Driver response time | Customer satisfaction |
| NTC | Call drop rate | Network reliability |
| Daraz | Order fulfillment time | Competitive edge |
| A mock dashboard showing Pathao’s driver response time (avg. 5 mins) with a green/red traffic light.
Information Control Methods
- Reports: Monthly sales reports (e.g., Kathmandu Valley Bank).
- Dashboards: Real-time metrics (e.g., Ncell’s network dashboard).
- Feedback Systems: Customer surveys (e.g., eSewa’s app ratings).
Worked Example: Kathmandu Traffic Routes
- Standard: 30-minute commute to Thapathali.
- Data: Google Maps traffic data.
- Action: Adjust traffic signals dynamically (like Singapore’s smart traffic).
In the Real World
eSewa’s Feedback Loop
- Idea: Control process (measure → compare → correct).
- How: Users report payment failures → eSewa’s team fixes glitches → reduces complaints by 40%.
NTC’s Call-Drop Analytics
- Idea: Information control (KPIs).
- How: Real-time call-drop data → identifies weak zones → towers upgraded in Pokhara.
Daraz’s Inventory Turnover
- Idea: Financial control (budget vs. actual).
- How: Tracks stock levels → avoids overstocking → saves $500K/year.
Exam Tip
- For Definitions: Always include sender-receiver in communication and feedback loop in control.
- For Barriers: Use real examples (e.g., "Ncell’s multilingual support handles cultural barriers").
- For Control Process: Draw the cycle diagram and label all 4 steps.
- For Financial Control: Compare budget vs. actual with a worked example (e.g., bank loan defaults).
- For KPIs: Mention Pathao/drivers or NTC/call drops—examiners love Nepali ties.
- For Men/Women Styles: Link to conflict resolution (e.g., "Women’s indirect style reduces workplace tension").
Common Pitfalls:
- ❌ Forgetting feedback in communication.
- ❌ Describing control as one-time (it’s a cycle).
- ❌ Not using Nepali examples (exams favor local context).
Final Visual: Control in a Nepali Bank
flowchart TD
    A["Nabil Bank Sets Loan Interest Rate: 10%"] --> B["Measures Actual Repayment Rate: 92%"]
    B --> C["Compares: 92% < 100% (Standard)"]
    C --> D["Action: Offers lower rates to struggling borrowers"]
    D --> A
| A bank’s control cycle for loan repayment rates.
Based on the TU BIT syllabus for Principles of Management (MGT205), unit 8.
Discussion
Loading…