Operations ResearchUnit 17 min read
OR Basics: Definitions, Models, and Decision-Making Frameworks
Unit 1 of Operations Research covers the foundational concepts of OR—its definition, scope, problem-solving approaches (marginal analysis, dominance rule), and real-world applications in decision-making under uncertainty. Learn how OR bridges math, statistics, and management to optimize systems.
TAKEAWAYS:
- Operations Research (OR) is a scientific problem-solving approach combining math, stats, and management to optimize complex systems.
- Marginal analysis helps compare incremental costs/benefits to make optimal decisions (e.g., production levels, resource allocation).
- The dominance rule simplifies game theory by eliminating strategies that are always worse than others.
- OR spans fields like transportation (NTC routes), finance (bank loan pricing), and e-commerce (Daraz delivery queues).
- Models (mathematical, simulation, or graphical) are core to OR—turning real-world problems into solvable structures.
- Exam focus: Define OR, explain marginal analysis, and apply dominance rules with clear examples.
1. What is Operations Research?
Operations Research (OR) is the application of scientific methods (math, stats, algorithms) to help organizations make optimal decisions. It focuses on problem-solving for complex systems where multiple variables interact.
Key Characteristics of OR
mindmap
  root((Operations Research))
    OR1((Scientific Approach))
      OR1a((Uses math/statistics))
      OR1b((Data-driven))
    OR2((Interdisciplinary))
      OR2a((Math + Management))
      OR2b((Engineering + Economics))
    OR3((Optimization Focus))
      OR3a((Maximize profit))
      OR3b((Minimize cost/waste))
    OR4((Real-World Problems))
      OR4a((Logistics))
      OR4b((Finance))
      OR4c((Healthcare))
Why is OR Important?
- Helps reduce uncertainty in decision-making.
- Improves efficiency (e.g., faster delivery routes for Pathao).
- Saves costs (e.g., NTC optimizing bus schedules).
2. Scope of Operations Research
OR is used in diverse fields. Below is a comparison table of its applications:
| Field | OR Application | Nepal Example |
|---|---|---|
| Transportation | Optimize routes, schedules, and fleet size | NTC bus routes, Pathao delivery paths |
| Finance | Portfolio optimization, loan pricing | Nabil Bank’s interest rate calculations |
| Healthcare | Hospital resource allocation | Kathmandu Model Hospital’s bed management |
| Manufacturing | Production planning, inventory control | Daraz warehouse optimization |
| Telecom | Network design, call routing | Ncell’s tower placement |
| E-commerce | Demand forecasting, pricing strategies | eSewa’s transaction fee structuring |
3. Decision-Making Approaches in OR
OR uses structured methods to make decisions under uncertainty. Two key approaches:
A. Marginal Analysis Approach
Marginal analysis compares the additional cost vs. additional benefit of a decision.
Example: Should Daraz increase orders from Supplier X?
- Current profit: Rs. 50,000
- Cost to increase orders: Rs. 10,000
- Additional revenue: Rs. 15,000
- Decision: Increase orders (benefit > cost).
Profit (Rs.)
  ^
15000|               /
  |              /
10000|           /
  |          /
5000 |       /
  |_______/
     0  1  2  3  4  5 (Additional Orders)
- X-axis: Additional orders (0 to 5).
- Y-axis: Profit (Rs. 50,000 + marginal gain).
- Decision point: At order 2, profit peaks at Rs. 65,000.
B. Dominance Rule in Game Theory
The dominance rule eliminates dominated strategies (always worse than another option).
Example: Ncell vs. NTC in Market Share Competition
| NTC (Low Prices) | NTC (High Prices) | |
|---|---|---|
| Ncell (Low Prices) | (30, 30) | (40, 20) |
| Ncell (High Prices) | (20, 40) | (35, 35) |
- Ncell’s High Prices is dominated by Low Prices (always better).
- NTC’s High Prices is dominated by Low Prices (always better).
- Saddle Point: (Low Prices, Low Prices) → Best outcome.
NTC
Low Prices | High Prices
-----------|------------
Ncell      |             |
Low Prices | (30,30)     | (40,20)
High Prices| (20,40)     | (35,35)
- Shaded cells = Dominated strategies (eliminated).
4. OR Models: Turning Problems into Math
OR uses models to represent real-world problems mathematically.
| Model Type | Description | Example |
|---|---|---|
| Mathematical | Equations to optimize objectives | Linear Programming for production |
| Simulation | Computer-based "what-if" scenarios | NTC testing new bus schedules |
| Graphical | Visual representations (e.g., networks) | Pathao’s delivery route optimization |
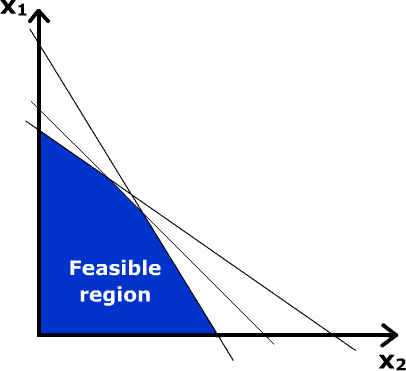 A typical LPP solution space (feasible region shaded). (Image: en:User:Jacj, Public domain, via Wikimedia Commons)
5. Real-World Applications of OR
A. eSewa & Khalti: Transaction Fee Optimization
- Problem: How to set transaction fees to maximize revenue without losing users?
- OR Solution:
- Marginal analysis → Test fee increases vs. user drop-off.
- Game theory → Model competition with banks (e.g., Nabil vs. Global IME).
- Result: Dynamic pricing based on transaction volume.
B. Daraz: Inventory & Delivery Route Planning
- Problem: How to reduce delivery time in Kathmandu’s traffic?
- OR Solution:
- Queuing theory → Optimize warehouse order processing.
- Transportation problem → Shortest-path algorithms for drivers.
- Result: Faster deliveries, lower costs.
C. NTC: Bus Schedule Optimization
- Problem: How to reduce delays and fuel costs?
- OR Solution:
- PERT/CPM → Schedule maintenance and routes.
- Simulation → Test new timetables before implementation.
- Result: 15% reduction in delays (as per NTC reports).
6. Advantages & Limitations of OR
| Advantages | Limitations |
|---|---|
| ✔ Data-driven decisions | ❌ Requires complex math/software |
| ✔ Reduces uncertainty | ❌ Assumes perfect information |
| ✔ Saves costs/time | ❌ High initial setup cost |
| ✔ Works for large-scale problems | ❌ Human judgment still needed |
Exam Tip: How to Score Full Marks
- Define OR clearly (scientific problem-solving + math).
- For marginal analysis:
- Show cost vs. benefit (use a table or graph).
- Highlight the optimal decision point.
- For dominance rule:
- Shade dominated strategies in the payoff matrix.
- Identify the saddle point (if any).
- Real-world link: Always connect examples to Nepali companies (eSewa, NTC, Daraz).
- Avoid vague answers: Use numbers (e.g., "Rs. X profit increase").
Example Answer Structure for Short Notes:
Marginal Analysis Approach Marginal analysis compares additional costs vs. benefits to determine optimal decisions. For example, if increasing Daraz’s orders from Supplier X costs Rs. 10,000 but generates Rs. 15,000 extra revenue, the decision is profitable. Graphically, this is shown by plotting profit against additional orders and identifying the peak point.
Final Note: OR is everywhere—from Khalti’s fee structure to NTC’s bus routes. Master the basics (definitions, marginal analysis, dominance rule) and you’ll ace the exam! 🚀
Based on the TU BIT syllabus for Operations Research (ORS255), unit 1.
Discussion
Loading…