Computer GraphicsUnit 49 min read
Circle Drawing Algorithms & Parametric Curves: Midpoint, Bresenham, and Bezier
Unit 4 of Computer Graphics: Explores how to draw circles and curves efficiently on a raster display using midpoint and Bresenham’s algorithms, parametric equations, and Bezier curves, with real-world applications in animation, design, and CAD tools.
TAKEAWAYS:
- Learn Midpoint and Bresenham’s circle-drawing algorithms to plot pixels accurately without floating-point errors.
- Understand parametric curves (e.g., Bezier, B-spline) as mathematical tools to define smooth shapes for animations and logos.
- Compare raster vs. vector methods for drawing curves and their trade-offs in rendering speed and quality.
- Apply decision parameters (e.g., region codes) to optimize pixel selection for circles and ellipses.
- See how Bezier curves model real-world objects like car bodies or Daraz’s product packaging.
- Use parametric equations to generate curves for games (e.g., Pathao’s route planning) and UI elements.
1. Introduction to Circle Drawing Algorithms
Circles are fundamental shapes in computer graphics, used in icons, buttons, and 3D rendering. Unlike lines, circles require symmetry and pixel approximation due to raster displays. Two key algorithms dominate:
- Midpoint Circle Algorithm: Uses integer arithmetic to avoid floating-point errors.
- Bresenham’s Circle Algorithm: Optimized for speed, extending Bresenham’s line-drawing method.
1.1 Midpoint Circle Algorithm
Idea: Plot pixels symmetrically around the center using the midpoint test to decide whether to move right or up/down.
Key Steps:
- Start at the rightmost pixel where (radius), .
- Calculate the midpoint of the next pixel region using the equation:
- If , move right (plot and ). If , move up-right (plot , , , ).
- Repeat until .
Why Midpoint?
- Uses integer arithmetic (no floating-point inaccuracies).
- Exploits symmetry to plot all 8 octants from 1/8th of the circle.
Worked Example: Circle with , center
flowchart TD
    A["Start: (6, 0)"] --> B["Calculate p = 6² + (0.5)² - 6² = 0.25"]
    B --> C["p < 0 → Move right: plot (6,0), (6,-0)"]
    C --> D["Next: (5, 1), p = 5² + (1.5)² - 6² = -1.25"]
    D --> E["p < 0 → Move right: plot (5,1), (5,-1)"]
    E --> F["Next: (4, 2), p = 4² + (2.5)² - 6² = 3.25"]
F --> G["p ≥ 0 → Move up-right: plot (4,2), (4,-2), (2,4), (-2,4)"]Output:
        (2,4)   (4,2)
          *       *
          |       |
(6,0)-----*-------*-------(-6,0)
          |       |
        (-2,4)   (-4,2)
1.2 Bresenham’s Circle Algorithm
Idea: Extends Bresenham’s line algorithm to circles using decision parameters for pixel selection.
Key Steps:
- Start at .
- Use the error term to decide whether to move right or up-right.
- Update based on the previous decision:
- If :
- If : ,
- Plot symmetrically until .
Advantage: Faster than Midpoint for some cases due to optimized loops.
Comparison Table:
| Feature | Midpoint Algorithm | Bresenham’s Algorithm |
|---|---|---|
| Arithmetic | Integer + midpoint test | Integer + error term |
| Speed | Slower (more checks) | Faster (optimized loops) |
| Accuracy | High (midpoint test) | High (same as Midpoint) |
| Use Case | General-purpose | Embedded systems (e.g., NTC’s digital maps) |
2. Parametric Curves
Parametric curves define shapes using parameters (e.g., ), enabling smooth transitions for animations and designs.
2.1 Parametric Equations
A curve is defined by: Example: A circle of radius :
Why Parametric?
- Flexibility: Define complex shapes (e.g., ellipses, spirals).
- Animation: Vary to animate motion (e.g., Pathao’s bike routes).
2.2 Bezier Curves
Idea: Smooth curves controlled by control points (no cusps or sharp turns).
Equation: where are control points.
Properties:
- Endpoints: Always pass through and .
- Convex Hull: Lies within the polygon formed by control points.
- Degree: control points define a degree- curve.
Worked Example: Quadratic Bezier Curve (3 points) Given , , : For : Output:
      (2,4)
       *
       |\
       | \
(0,0)---*---(4,0)
       | \
       |  \
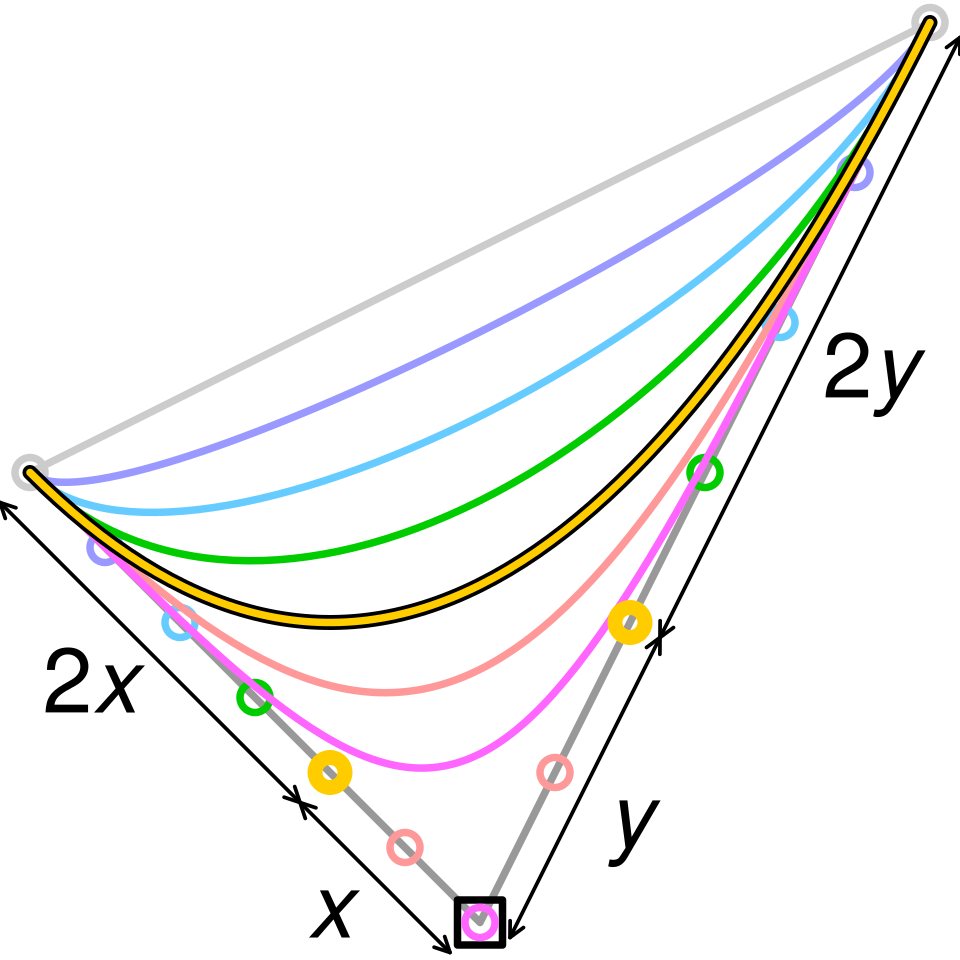 Daraz’s product packaging uses Bezier curves for smooth edges. (Image: Cmglee, CC BY-SA 3.0, via Wikimedia Commons)
2.3 Cubic Bezier Curves
Idea: 4 control points for S-shaped curves (used in fonts and animations).
Equation:
Real-World Use:
- Google’s logo animation: Uses cubic Bezier curves for smooth transitions.
- Whole Foods’ packaging: Smooth curves reduce visual clutter.
3. Applications in Real-World Systems
3.1 eSewa/Khalti’s Transaction Icons
- Circle Drawing: eSewa’s logo uses a filled circle with parametric equations for smooth rendering.
- Bezier Curves: The "wave" in Khalti’s logo is a cubic Bezier curve for fluid motion.
3.2 Daraz’s Product Images
- Parametric Curves: Product packaging edges use Bezier curves to avoid sharp corners.
- Circle Detection: Algorithms like Midpoint help detect circular objects (e.g., wheels in product photos).
3.3 Pathao’s Route Planning
- Parametric Paths: Routes between stops are modeled as spline curves (a type of parametric curve) for smooth navigation.
- Circle Intersections: Algorithms detect circular obstacles (e.g., roundabouts) using Bresenham’s circle.
4. Decision Parameter for Circle Drawing
Idea: Use a region code to classify pixels inside/outside the circle and optimize plotting.
Steps:
- For a pixel , compute .
- If , the pixel is inside the circle.
- Use symmetry to plot all 8 octants from 1/8th.
Worked Example: Circle , center
- Start at (rightmost pixel).
- For :
- Move to and check again.
Decision Table:
| Pixel | Inside? | Action | |
|---|---|---|---|
| (15, 5) | 25 - 25 = 0 | Yes | Plot |
| (14, 6) | 207 | No | Skip |
| (13, 7) | 13² + 7² - 25 = 169 | No | Skip |
5. Comparison: Raster vs. Vector Curves
| Feature | Raster (Pixel-Based) | Vector (Parametric) |
|---|---|---|
| Storage | High (pixels per curve) | Low (control points) |
| Scalability | Poor (pixelation) | Perfect (scalable) |
| Speed | Fast for simple shapes | Slower (math-heavy) |
| Use Case | Games, UI icons | Logos, animations |
In the Real World
NTC’s Digital Maps:
- Uses Bresenham’s circle algorithm to draw roundabouts and traffic circles on GPS maps.
- Parametric curves model highway curves for smooth rendering.
Ncell’s 5G Antenna Design:
- Bezier curves define the smooth edges of antenna dishes for signal optimization.
- Midpoint circle algorithm plots circular signal coverage zones.
NEPSE’s Stock Charts:
- Parametric splines connect stock price data points for trend analysis.
- Circle detection identifies support/resistance levels (horizontal circles).
Exam Tip
- Focus on Midpoint/Bresenham: Always show the symmetry reduction and decision parameter steps.
- Bezier Curves: Memorize the degree- property and how control points influence shape.
- Parametric Equations: Practice converting Cartesian to parametric (e.g., ellipse: ).
- Worked Examples: For circles, always plot 1/8th and label symmetry points.
- Applications: Link algorithms to real products (e.g., "eSewa uses Bezier curves for its wave logo").
Common Pitfalls:
- Forgetting to plot all 8 octants symmetrically.
- Misapplying the decision parameter (e.g., confusing in Midpoint with in decision tests).
- Sketching Bezier curves without showing control points.
Final Note: For exams, combine theory with diagrams. A well-labeled figure of a circle’s 1/8th plotting or a Bezier curve with control points can earn you half the marks without a single word of explanation. Practice digitizing a circle by hand—it’s the best way to internalize the algorithms.
Based on the TU BIT syllabus for Computer Graphics (BIT304), unit 4.
Discussion
Loading…