System Analysis and DesignUnit 77 min read
Data Modeling & Conceptual Design: ER Diagrams, Logical/Physical DB Design
Unit 7 of System Analysis and Design covers how to model data requirements into conceptual schemas (ER diagrams), transform them into logical database designs (tables, keys, relationships), and map those to physical storage (indexes, normalization). Learn the 3-schema architecture, cardinality rules, and how to design
What is Data Modeling?
Data modeling is the process of defining and analyzing data requirements needed to support business processes. It creates a blueprint of how data flows, stores, and relates in a system. There are three levels of data modeling:
Conceptual Data Model (Business View)
- Focuses on what data is needed (entities, attributes, relationships).
- Uses ER diagrams (Entity-Relationship models).
- Independent of any database system.
Logical Data Model (System View)
- Defines how data is structured (tables, keys, constraints).
- Uses relational schema (e.g.,
Student(ID, Name, DOB)). - Independent of physical storage.
Physical Data Model (Technical View)
- Specifies where and how data is stored (file formats, indexes, partitions).
- Depends on the DBMS (e.g., MySQL, Oracle).
Why is Data Modeling Important?
- Clarifies business needs before coding.
- Reduces errors by validating data requirements early.
- Improves efficiency by optimizing storage and queries.
- Supports scalability (e.g., Daraz’s inventory system handles millions of products).
Conceptual Data Modeling: ER Diagrams
An ER diagram visually represents:
- Entities (e.g.,
Customer,Order,Product). - Attributes (properties of entities, e.g.,
Customer.Name,Order.Date). - Relationships (how entities interact, e.g.,
Customer PLACES Order).
Key Symbols in ER Diagrams
erDiagram
    ENTITY ||--o{ ATTRIBUTE : "has"
    ENTITY ||--o{ RELATIONSHIP : "participates in"
    RELATIONSHIP }|--|| ENTITY : "connects"
    ENTITY {
        string name
        int id
    }
    ATTRIBUTE {
        string type
        boolean is_primary_key
    }
    RELATIONSHIP {
        string type "1:1, 1:N, M:N"
        string name
    }
Worked Example: eSewa Transaction System
Scenario: Model data for eSewa’s mobile payment system. Entities:
- User (ID, Name, Phone, Email)
- Transaction (ID, Amount, Date, Status)
- ServiceProvider (ID, Name, Category)
Relationships:
- A User can make many Transactions (1:N).
- A Transaction is for one ServiceProvider (N:1).
erDiagram
    USER ||--o{ TRANSACTION : "makes"
    TRANSACTION ||--|| SERVICE_PROVIDER : "pays for"
    USER {
        int user_id PK
        string name
        string phone
    }
    TRANSACTION {
        int transaction_id PK
        decimal amount
        date timestamp
        string status
    }
    SERVICE_PROVIDER {
        int provider_id PK
        string name
        string category
    }
Cardinality and Relationship Types
Cardinality defines how many instances of one entity relate to another. Common types:
| Type | Description | Example |
|---|---|---|
| One-to-One (1:1) | One record in Entity A links to one in Entity B. | Passport to Citizen (1:1). |
| One-to-Many (1:N) | One record in A links to many in B. | Customer to Order (1:N). |
| Many-to-Many (M:N) | Many in A link to many in B. | Student to Course (M:N, resolved via Enrollment). |
Note: M:N relationships are always resolved by creating a junction entity (e.g., Enrollment for Student-Course).
Logical Database Design: Tables and Keys
Step 1: Convert ER Diagram to Relational Schema
For the eSewa example:
- User →
User(user_id, name, phone, email) - Transaction →
Transaction(transaction_id, user_id, amount, date, status) - ServiceProvider →
ServiceProvider(provider_id, name, category)
Step 2: Define Keys
- Primary Key (PK): Uniquely identifies a record (e.g.,
user_id). - Foreign Key (FK): Links to a PK in another table (e.g.,
user_idinTransactionreferencesUser.user_id). - Composite Key: Multiple columns as PK (e.g.,
Student_ID + Course_IDinEnrollment).
Step 3: Normalization
Normalization reduces data redundancy and anomalies (update, insert, delete issues). Follow these normal forms:
| Normal Form | Rule | Example Violation |
|---|---|---|
| 1NF | Each table cell has a single value. | Storing Name: "John, Doe" in one cell. |
| 2NF | No partial dependencies (all non-key attributes depend on full PK). | Order(order_id, customer_id, product, price) → product depends only on order_id. |
| 3NF | No transitive dependencies (non-key attributes must depend only on PK). | Customer(customer_id, name, city, postal_code) → postal_code depends on city. |
Worked Example: Normalizing Daraz’s Order System
Unnormalized Table:
Order(order_id, customer_name, product1, product2, total_amount)
3NF Tables:
Customer(customer_id, name, address)Product(product_id, name, price)Order(order_id, customer_id, date, total_amount)OrderItem(order_id, product_id, quantity)
Physical Database Design
Key Decisions:
- Storage Engine: InnoDB (ACID compliance) vs. MyISAM (faster reads).
- Indexing: Add indexes on
FKcolumns (e.g.,user_idinTransaction). - Partitioning: Split large tables by
date(e.g.,Transaction_2023,Transaction_2024). - Data Types: Use
VARCHAR(50)for names,DECIMAL(10,2)for money.
Example: Ncell’s Customer Database
CREATE TABLE Customer (
    customer_id INT PRIMARY KEY AUTO_INCREMENT,
    name VARCHAR(100) NOT NULL,
    phone VARCHAR(15) UNIQUE,
    join_date DATE,
    INDEX idx_phone (phone)
);

CREATE TABLE Subscription (
    subscription_id INT PRIMARY KEY,
    customer_id INT,
    plan_type ENUM('Basic', 'Premium', 'Unlimited'),
    start_date DATE,
    end_date DATE,
    FOREIGN KEY (customer_id) REFERENCES Customer(customer_id),
    INDEX idx_plan (plan_type)
);
In the Real World
eSewa
- Conceptual Model: ER diagram with
User,Transaction, andServiceProvider. - Logical Design: Tables for transactions with
user_idas FK. - Physical Design: Indexes on
transaction_idanddatefor fast queries.
- Conceptual Model: ER diagram with
Daraz
- M:N Relationship:
CustomertoProductviaOrderItemjunction table. - Normalization: Separates
Product(name, price) fromInventory(stock, location).
- M:N Relationship:
NEPSE (Nepal Stock Exchange)
- Cardinality:
Trader(1) toTrade(N) toShare(1). - Physical Design: Partitioned tables by
trade_datefor performance.
- Cardinality:
Exam Tip
- ER Diagrams: Always show entities, attributes, and relationships with correct cardinality. Label PKs and FKs.
- Normalization: Questions often ask to convert unnormalized tables to 3NF. Practice with real examples (e.g., bank accounts, hospital records).
- Logical vs. Physical Design:
- Logical = "What tables do we need?" (e.g.,
Student,Course). - Physical = "How do we store them?" (e.g., indexes, partitioning).
- Logical = "What tables do we need?" (e.g.,
- Worked Examples: For questions like "Design a database for a retail store," start with an ER diagram, then normalize, then write SQL
CREATE TABLEstatements. - Common Pitfalls:
- Forgetting to resolve M:N relationships with junction tables.
- Not defining PKs/FKs in logical design.
- Ignoring data types in physical design (e.g., using
VARCHARfor numbers).
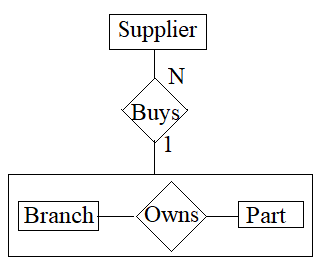 ER diagram symbols: rectangle (entity), oval (attribute), diamond (relationship) (Image: Jarfuls of Tweed, CC BY-SA 4.0, via Wikimedia Commons)
 Physical storage for databases (e.g., Ncell’s servers) (Image: Federal Bureau of Investigation, Public domain, via Wikimedia Commons)
Based on the TU BSc CSIT syllabus for System Analysis and Design (CSC315), unit 7.
Discussion
Loading…