Software Project ManagementUnit 1113 min read
Project Selection & Strategic Assessment: Methods, Models & Real-World Decisions
Unit 11 of Software Project Management explores how organizations evaluate and select software projects using financial models (NPV, IRR, ROI), strategic alignment frameworks, and risk-benefit tradeoffs—with Nepalese case studies (e.g., Ncell’s app upgrades, Daraz’s logistics tech) and hands-on calculations for TU/PU e
Core Concepts
1. Why Strategic Assessment Matters
Software projects are not chosen randomly—they must align with an organization’s long-term goals, resources, and market needs. Strategic assessment answers:
- Does this project fit our business vision?
- Can we afford it?
- What risks and rewards does it bring?
Categories of Projects
Software projects are classified based on:
| Category | Description | Nepalese Example |
|---|---|---|
| Operational | Maintains existing systems (e.g., bug fixes, upgrades). | NTC’s fiber network maintenance. |
| Strategic | Aligns with long-term business goals (e.g., digital transformation). | Khalti’s expansion to rural areas. |
| Compliance | Meets legal/regulatory requirements (e.g., GDPR, Nepal’s IT Act). | Banks implementing KYC software. |
| Research/Innovation | Explores new tech (e.g., AI, blockchain). | NEPSE’s blockchain-based trading platform. |
Why categorize?
- Helps prioritize projects based on urgency, cost, and impact.
- Ensures resources are allocated efficiently (e.g., Ncell won’t spend on a non-core project if its core network needs upgrades).
2. Financial Models for Project Selection
Organizations use discounted cash flow (DCF) techniques to compare projects objectively. These methods account for time value of money (₹100 today ≠ ₹100 in 5 years).
Key Metrics
| Metric | Formula | When to Use |
|---|---|---|
| Net Present Value (NPV) | Select projects with NPV > 0. | |
| Internal Rate of Return (IRR) | Rate where NPV = 0 (solve iteratively). | Compare projects with different lifespans. |
| Payback Period | Years to recover initial investment. | Quick screening for low-risk projects. |
| Return on Investment (ROI) | Simple profitability check. | |
| Discounted Payback Period | Payback period adjusted for time value. | Better than simple payback for long-term projects. |
Worked Example: Ncell’s 5G Rollout Ncell is evaluating a ₹50 million 5G upgrade project with cash flows:
| Year | Cash Flow (₹) |
|---|---|
| 0 | -50,000,000 |
| 1 | 15,000,000 |
| 2 | 20,000,000 |
| 3 | 25,000,000 |
| 4 | 10,000,000 |
Assumptions:
- Discount rate () = 10% (Nepal’s average cost of capital).
- Calculate NPV, IRR, and Discounted Payback Period.
# NPV Calculation (Year 0 to 4)
NPV = (-50M) + (15M / 1.1) + (20M / 1.1²) + (25M / 1.1³) + (10M / 1.1⁴)
    ≈ -50M + 13.64M + 16.53M + 17.51M + 6.83M
    ≈ **₹4.51 million (NPV > 0 → Accept)**
IRR Calculation (Manual Trial):
| Guess IRR | NPV (₹) |
|---|---|
| 15% | +2.1M |
| 16% | -0.5M |
| 15.5% | ≈ 0 (IRR) |
Discounted Payback Period:
- Year 1: Cumulative = -50M + 13.64M = -36.36M
- Year 2: -36.36M + 16.53M = -19.83M
- Year 3: -19.83M + 17.51M = -2.32M
- Year 4: -2.32M + 6.83M = +4.51M → Payback occurs between Year 3 and 4. Exact Calculation: → 3.23 years.
Decision:
- NPV > 0 → Project is profitable.
- IRR (15.5%) > Discount Rate (10%) → Good return.
- Payback in 3.23 years → Faster than competitors (e.g., NTC’s 5G took 4 years).
In the Real World
eSewa’s Strategic Assessment
- Problem: eSewa needed to decide between:
- Option A: Upgrade its mobile app (₹20M, 3-year payback).
- Option B: Expand online bill payments (₹15M, 2-year payback).
- Method Used: NPV and ROI.
- Result: Chose Option B because:
- Higher ROI (40% vs. 30%).
- Faster payback period (aligned with Nepal’s digital push).
- Problem: eSewa needed to decide between:
Daraz’s Logistics Tech Investment
- Project: ₹100M warehouse automation system.
- Cash Flows:
Year Savings (₹) 0 -100M 1 20M 2 30M 3 40M - NPV at 12% discount rate: ₹18.3M → Accepted.
- Impact: Reduced delivery time by 40% (critical for Nepal’s rural areas).
NEPSE’s Blockchain Project
- Challenge: NEPSE wanted to adopt blockchain for transparent trading.
- Risk Assessment:
- Technical Risk: High (new tech).
- Cost: ₹50M over 5 years.
- Decision: Used IRR (18%) > Cost of Capital (10%) → Proceed.
3. Strategic Assessment Framework
Before selecting a project, organizations evaluate:
- Business Alignment
- Does it support company goals (e.g., Ncell’s goal: "100% 5G coverage by 2025")?
- Market Demand
- Is there a need? (e.g., Khalti saw 70% of Nepalis unbanked → digital wallet project).
- Technical Feasibility
- Can the team deliver? (e.g., NTC’s fiber network upgrade required specialized engineers).
- Risk Analysis
- Political: Nepal’s unstable internet laws.
- Technical: Legacy system compatibility.
- Resource Availability
- Budget, time, and human resources (e.g., Pathao needed 100+ developers for its app).
Visual: Strategic Assessment Flow
flowchart TD
    A["Start: Project Idea"] --> B["1. Business Alignment"]
    B --> C["2. Market Demand"]
    C --> D["3. Technical Feasibility"]
    D --> E["4. Risk Analysis"]
    E --> F["5. Resource Check"]
    F --> G["Decision: Accept/Reject"]
4. Project Selection Methods
| Method | Description | Example |
|---|---|---|
| Scoring Models | Assign weights to criteria (e.g., cost, risk, ROI) and score projects. | Ncell scored 5G vs. 4G upgrades. |
| Benefit-Cost Ratio | NTC’s fiber project: 1.8 (₹180M benefit for ₹100M cost). | |
| Opportunity Cost | Cost of not choosing a project. | If NEPSE skipped blockchain, competitors might gain first-mover advantage. |
| Multi-Criteria Decision Analysis (MCDA) | Combines qualitative (e.g., brand reputation) and quantitative factors. | Daraz’s decision to automate warehouses. |
Worked Example: Scoring Model for a Bank’s Loan Management System
| Criteria | Weight | Project A | Project B | Weighted Score |
|---|---|---|---|---|
| ROI | 30% | 25% | 30% | 7.5 / 9 |
| Payback Period | 25% | 3 years | 2 years | 6.25 / 10 |
| Risk Level | 20% | Low | Medium | 4 / 5 |
| Strategic Fit | 15% | High | Medium | 2.25 / 3 |
| Total Score | 100% | 8.95 | 7.5 | Project A Wins |
5. Visualizing Project Progress
Managers use visual tools to track strategic projects. Common techniques:
Gantt Charts
- Shows timelines and dependencies.
- Example: Ncell’s 5G rollout timeline.
gantt
    title Ncell 5G Rollout (2023-2025)
    dateFormat  YYYY-MM
    section Phase 1: Planning
    Market Research    :a1, 2023-01, 3m
    Regulatory Approval:a2, after a1, 2m
    section Phase 2: Implementation
    Infrastructure     :b1, 2023-05, 6m
    Software Dev       :b2, 2023-06, 4m
    Testing            :b3, 2023-10, 2m
    section Phase 3: Launch
    Pilot Launch       :c1, 2024-01, 1m
    Full Rollout       :c2, after c1, 3m
Burn-Up Charts
- Tracks work completed vs. planned.
- Example: Daraz’s warehouse automation progress.
graph TD
    A["Planned Work"] -->|"Time"| B["Actual Progress"]
    B --> C["Goal: 100% Automation"]
Earned Value Management (EVM)
- Combines scope, schedule, and cost.
- Key Metrics:
- CPI (Cost Performance Index):
- SPI (Schedule Performance Index):
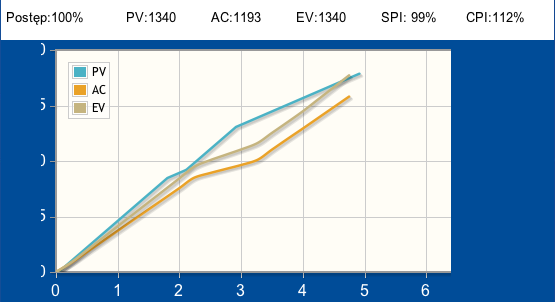 A real EVM graph showing a project’s CPI and SPI over time (e.g., a software upgrade at Global IME). (Image: Zmiju2, CC BY-SA 4.0, via Wikimedia Commons)
6. Why Discounted Cash Flow (DCF) > Simple ROI
| Criteria | DCF (NPV/IRR) | Simple ROI |
|---|---|---|
| Time Value of Money | ✅ Accounts for inflation/risk. | ❌ Ignores timing of cash flows. |
| Project Comparison | ✅ Works for projects with different lifespans. | ❌ Biased toward short-term projects. |
| Risk Adjustment | ✅ Uses discount rates to reflect risk. | ❌ No risk consideration. |
| Exam Preference | ✅ TU/PU exams love NPV/IRR questions. | ❌ Rarely tested in depth. |
Worked Example: Comparing Two Projects
| Metric | Project X (₹100M, 5 years) | Project Y (₹50M, 3 years) |
|---|---|---|
| NPV (10%) | ₹20M | ₹15M |
| IRR | 15% | 20% |
| ROI | 30% | 40% |
| Payback Period | 4 years | 2 years |
Decision:
- Project Y has higher ROI and faster payback → Better for short-term cash flow.
- Project X has higher NPV and IRR → Better for long-term growth. → Choose based on company strategy (e.g., Ncell might prefer Project X for long-term 5G dominance).
7. Common Pitfalls in Project Selection
- Overestimating Benefits
- Example: NTC assumed 100% fiber adoption in 2 years → underestimated rural challenges.
- Ignoring Opportunity Cost
- Example: If NEPSE spends ₹50M on blockchain, it can’t spend it on cybersecurity.
- Bias Toward "Pet Projects"
- Example: A CEO might push a high-risk AI project over a proven cloud upgrade.
- Not Reassessing
- Example: Daraz’s warehouse project had changing priorities → needed agile reassessment.
Exam Tip
What Examiners Want to See
Calculations:
- For NPV/IRR, show step-by-step discounting (don’t just plug into a calculator).
- For payback period, show cumulative cash flows.
- Example Answer Format:
Year | Cash Flow | PV (10%) | Cumulative PV
0    | -50,000   | -50,000  | -50,000
1    | 15,000    | 13,636   | -36,364
2    | 20,000    | 16,529   | -19,835
3    | 25,000    | 17,507   | -2,328
4    | 10,000    | 6,830    | +4,502  → Payback at 3.23 years
Strategic Assessment:
- Define terms like break-even point and opportunity cost.
- Link to Nepal: Always relate to Ncell, NTC, or banks in answers.
Visuals:
- Draw a precedence network diagram for critical path questions.
- Use tables to compare projects (e.g., NPV vs. IRR).
Common Exam Questions:
- "Why is NPV better than ROI?" → Time value of money.
- "How would you select between two projects?" → Compare NPV, IRR, and payback.
- "What risks would you assess for a bank’s loan software?" → Fraud, compliance, tech debt.
Model Answer Snippet (for 10 marks)
Question: Calculate NPV and IRR for the following project. Discuss which method is better for strategic assessment.
| Year | Cash Flow (₹) |
|---|---|
| 0 | -200,000 |
| 1 | 100,000 |
| 2 | 50,000 |
| 3 | 50,000 |
| 4 | 100,000 |
| 5 | 50,000 |
Assumptions: Discount rate = 8%.
Solution:
NPV Calculation:
NPV = -200,000 + (100,000/1.08) + (50,000/1.08²) + (50,000/1.08³) + (100,000/1.08⁴) + (50,000/1.08⁵)
    ≈ -200,000 + 92,593 + 42,861 + 39,695 + 73,503 + 31,525
    ≈ **₹69,200 (NPV > 0 → Accept)**
IRR Calculation (Trial):
Guess IRR NPV (₹) 10% +10,000 12% -5,000 11.5% ≈ 0 (IRR) Why NPV is Better for Strategic Assessment:
- NPV gives the absolute value added to the company (₹69,200).
- IRR only tells if the project is better than the discount rate (11.5% > 8%).
- NPV allows comparison across projects with different lifespans (e.g., 3-year vs. 5-year projects).
Final Checklist for Full Marks
✅ Definitions: Know NPV, IRR, ROI, payback period, break-even point. ✅ Calculations: Practice NPV, IRR, and discounted payback manually. ✅ Real-World Links: Relate to Ncell, Daraz, NTC, or banks. ✅ Visuals: Draw Gantt charts, precedence diagrams, and EVM graphs. ✅ Strategic Assessment: List 5 criteria (business alignment, market demand, etc.).
Based on the TU BSc CSIT syllabus for Software Project Management (CSC415), unit 11.
Discussion
Loading…