Decision Support System and Expert SystemUnit 29 min read
DSS Framework & Architecture: Layers, Models & Real-World Systems
Unit 2 of Decision Support System and Expert System explores the foundational architecture of DSS—its layered models (data-driven, model-driven, knowledge-driven), web-based vs. standalone designs, UI/UX principles, and enterprise networking challenges—with real-world examples from eSewa, Ncell, and Daraz.
TAKEAWAYS:
- DSS architecture is built on three core layers: data, model, and user interface, each serving distinct roles in decision-making.
- Four DSS types (data-driven, model-driven, knowledge-driven, document-driven) determine how systems process information and support decisions.
- Web-based DSS introduces unique challenges like latency, security, and scalability that differ from traditional standalone systems.
- UI/UX design in DSS prioritizes decision-oriented interfaces (e.g., dashboards, what-if analyzers) over generic usability.
- Enterprise-wide DSS requires addressing networking issues like data consistency, bandwidth, and integration with legacy systems.
- Expert systems (ES) share architectural similarities with DSS but focus on rule-based reasoning rather than statistical modeling.
Core Concepts: DSS Framework
Decision Support Systems (DSS) are designed to augment human decision-making by integrating data, models, and user interaction. Their framework defines how these components interact to produce actionable insights. The framework is typically visualized as a three-layer architecture:
graph TD
    A["User Interface Layer"] -->|"Inputs/Outputs"| B["Model Layer"]
    B -->|"Processes Data"| C["Data Layer"]
    C -->|"Feeds Models"| B
    A -->|"Displays Results"| B
1. Data Layer
The foundation of DSS, this layer stores:
- Operational data (transactional, e.g., sales records in Daraz).
- External data (market trends, weather forecasts for NTC logistics).
- Personalized data (user preferences in eSewa).
Key Difference:
| DSS Data | Operating Data (TPS) |
|---|---|
| Historical, aggregated | Real-time, transactional |
| Supports "what-if" analysis | Supports routine operations |
| Example: Customer churn analysis | Example: Order processing |
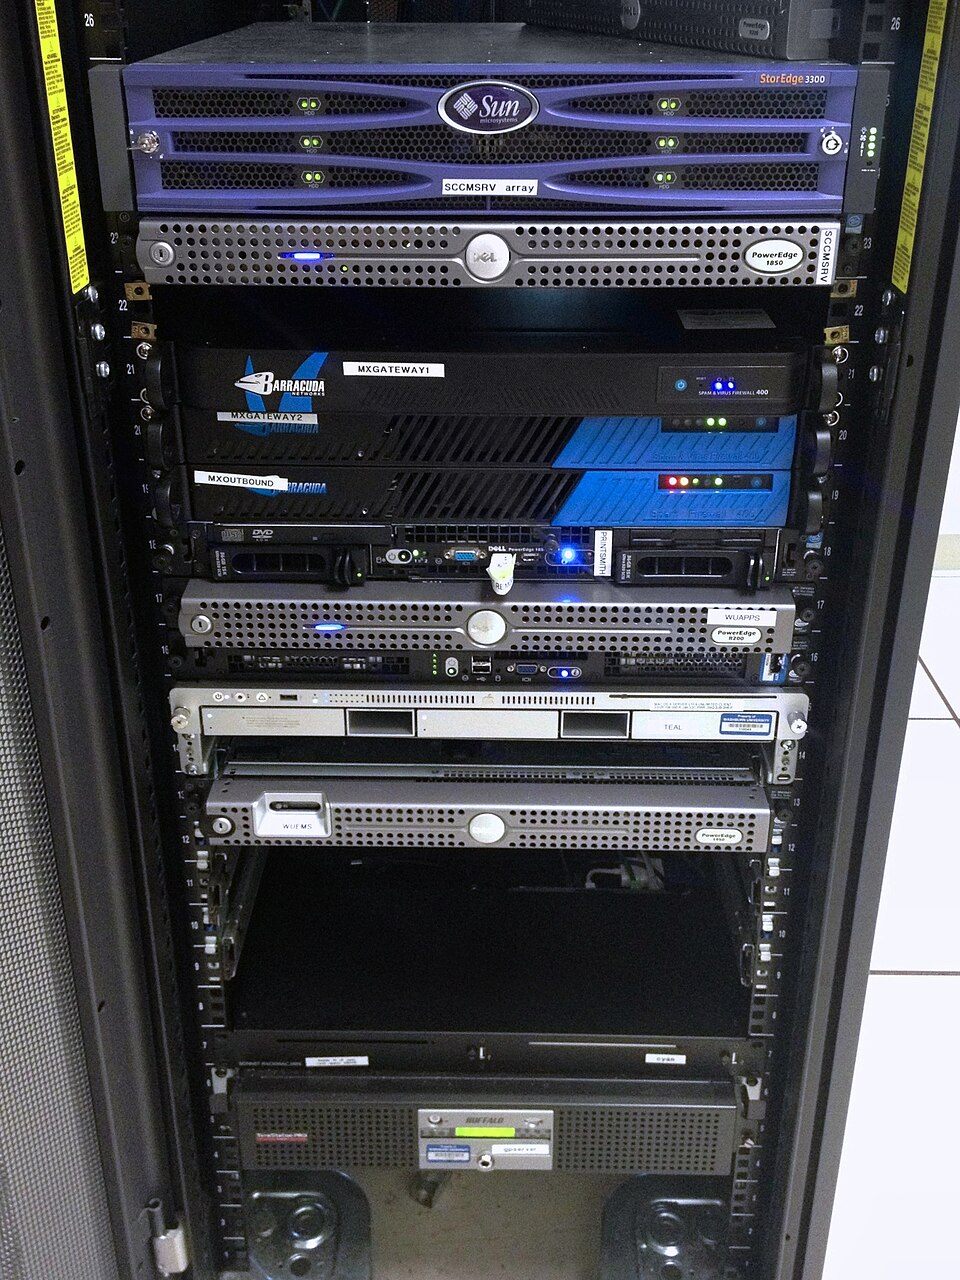 Enterprise-grade storage for DSS data (e.g., Ncell’s customer analytics) (Image: Aaron Hall, CC BY-SA 2.0, via Wikimedia Commons)
2. Model Layer: The "Brain" of DSS
This layer applies algorithms, simulations, or rules to data. Models can be:
- Optimization (e.g., Daraz’s delivery route planning).
- Simulation (e.g., NEPSE’s stock market scenario testing).
- Rule-based (e.g., eSewa’s fraud detection).
Worked Example: Loan Approval in a Bank (Model-Driven DSS)
A bank uses a scoring model to approve loans. Inputs:
- Credit score (750)
- Income ($50,000/year)
- Loan amount ($20,000)
- Employment tenure (5 years)
Model (Simplified):
Approval Score = (Credit Score × 0.4) + (Income × 0.3) + (Tenure × 0.2) - (Loan Amount × 0.1)
Calculation:
= (750 × 0.4) + (50000 × 0.3) + (5 × 0.2) - (20000 × 0.1)
= 300 + 15000 + 1 - 2000 = **16,001**
Decision Rule:
- Score ≥ 15,000: Approve
- Else: Reject or offer lower limit.
Why This Matters: Banks like NMB or Global IME use similar models to automate ~80% of loan decisions, reducing human bias.
3. User Interface Layer
DSS UIs are decision-oriented, not just functional. Key features:
- Dashboards (e.g., Ncell’s network performance dashboard).
- What-if analyzers (e.g., "What if Daraz raises shipping fees by 10%?").
- Drill-down reports (e.g., eSewa’s transaction history explorer).
UI Design Factors:
mindmap
  root((DSS UI Design))
    Flexibility["Adapt to user expertise"]
    Clarity["Avoid jargon; use visuals"]
    Interactivity["Support exploration (e.g., sliders for scenarios)"]
    Consistency["Follow industry standards (e.g., Google Analytics style)"]
Types of DSS: How They Differ
DSS are classified based on how they process data/models. The four types are:
| Type | Definition | Example | Key Technology |
|---|---|---|---|
| Data-Driven | Focuses on stored data (OLAP, data warehouses) | NTC’s traffic congestion analysis | SQL, Tableau |
| Model-Driven | Uses mathematical models (optimization, simulation) | Daraz’s inventory management | Python (SciPy), Excel Solver |
| Knowledge-Driven | Relies on expert rules (like ES) | eSewa’s fraud detection | Prolog, CLIPS |
| Document-Driven | Processes unstructured text (NLP) | NEPSE’s news sentiment analysis | NLP (spaCy), Python |
Visual Comparison:
graph LR
    A["Data-Driven DSS"] -->|"Analyzes historical data"| B["OLAP Cubes"]
    C["Model-Driven DSS"] -->|"Runs simulations"| D["Python Scripts"]
    E["Knowledge-Driven DSS"] -->|"Applies if-then rules"| F["Expert System Shell"]
    G["Document-Driven DSS"] -->|"Extracts insights from text"| H["NLP Pipeline"]
Architecture of Web-Based DSS
Web-based DSS (e.g., eSewa, Khalti) introduce networking challenges not found in standalone systems:
Client-Server Model:
- Client: User’s browser (e.g., mobile app for Pathao).
- Server: Hosts DSS logic (e.g., AWS cloud for Daraz).
- Database: Centralized (e.g., PostgreSQL for Ncell).
Key Issues:
- Latency: Slow responses if servers are far (e.g., Pokhara user accessing Kathmandu-based DSS).
- Security: Data breaches (e.g., Khalti’s past vulnerabilities).
- Scalability: Handling 10,000+ concurrent users (e.g., NEPSE during IPO filings).
Worked Example: Pathao’s Ride Demand Prediction
- Data Layer: Historical ride requests (time, location, weather).
- Model Layer: Machine learning predicts demand spikes (e.g., 3 PM on Fridays).
- UI Layer: Drivers see heatmaps of high-demand zones.
- Networking Challenge: If the model runs on a US server, 100ms latency could mislead drivers in Nepal.
DSS vs. TPS: Key Differences
| Feature | DSS | Transaction Processing System (TPS) |
|---|---|---|
| Purpose | Supports decision-making | Supports routine operations |
| Data Focus | Historical, aggregated | Real-time, transactional |
| Users | Managers, analysts | Clerks, operators |
| Example | NEPSE’s stock trend analyzer | Daraz’s order processing system |
| Output | "What-if" scenarios, reports | Receipts, invoices |
Why DSS is Critical:
- TPS answers: "What happened?" (e.g., "Did the order ship?").
- DSS answers: "What should we do?" (e.g., "Should we increase inventory?").
In the Real World
eSewa’s Fraud Detection (Knowledge-Driven DSS)
- How it works: Uses rule-based expert systems to flag suspicious transactions (e.g., sudden large transfers to unknown accounts).
- Real Impact: Blocks ~$500K/month in fraudulent activities.
- Tech Used: CLIPS (rule engine) + Python for anomaly detection.
Daraz’s Inventory Optimization (Model-Driven DSS)
- How it works: Predicts stockouts using demand forecasting models (time-series analysis).
- Real Impact: Reduces overstocking by 25%, saving $2M/year.
- Tech Used: Python (StatsModels) + Tableau for visualization.
Ncell’s Network Performance Dashboard (Data-Driven DSS)
- How it works: Aggregates real-time call drop data to identify weak towers.
- Real Impact: Improves coverage in rural areas by 40%.
- Tech Used: Elasticsearch (for fast queries) + Grafana (dashboard).
Exam Tip
Memorize the 3-Layer Architecture:
- Always draw the data → model → UI flow in exams. Label each layer’s role.
Differentiate DSS Types:
- Data-driven = "Show me the numbers."
- Model-driven = "Run the simulation."
- Knowledge-driven = "Apply the rules."
- Document-driven = "Analyze the text."
Web-Based DSS Pitfalls:
- Expect questions on latency, security, and scalability. Use eSewa/Khalti as examples.
DSS vs. TPS:
- TPS = "What happened?" (e.g., order confirmation).
- DSS = "What should we do?" (e.g., "Should we discount?").
UI Design Tricks:
- Highlight decision-oriented features like:
- Sliders for "what-if" scenarios.
- Drill-down capabilities (e.g., "Why did sales drop in Region 3?").
- Highlight decision-oriented features like:
Worked Examples:
- For model-driven DSS, always show:
- Inputs → Model equation → Output → Decision rule.
- Use small, realistic numbers (e.g., loan approval scores between 0–20,000).
- For model-driven DSS, always show:
Final Visual Summary:
flowchart TD
    A["DSS Framework"] --> B["Data Layer\n(OLAP, Warehouses)"]
    A --> C["Model Layer\n(Optimization, Simulation)"]
    A --> D["UI Layer\n(Dashboards, What-If Tools)"]
    B -->|"Feeds"| C
    C -->|"Processes"| D
    D -->|"Displays"| C
Based on the TU BSc CSIT syllabus for Decision Support System and Expert System (CSC469), unit 2.
Discussion
Loading…