Research Methods And Academic WritingUnit 515 min read
Quantitative Data Analysis: Tests, Models & Tools
Unit 5 of Research Methods And Academic Writing covers statistical techniques for analyzing quantitative data—when to use t-tests, chi-square, correlations, and regression—with real-world applications in Nepal (e.g., NEPSE stock trends, Ncell customer satisfaction surveys) and step-by-step examples (e.g., calculating l
Core Concepts: What Quantitative Analysis Does
Quantitative data analysis transforms raw numbers (e.g., survey responses, experiment measurements) into meaningful insights using statistical tests and models. Unlike qualitative methods, it focuses on numerical patterns, probabilities, and causal relationships. Key goals:
- Test hypotheses (e.g., "Does education level affect income?").
- Measure relationships (e.g., "How strongly do traffic jams correlate with fuel prices?").
- Predict outcomes (e.g., "What’s the probability a Daraz order will be delayed?").
Why it matters in social work research: Social workers use quantitative analysis to:
- Evaluate program effectiveness (e.g., "Did the NGO’s mental health workshop reduce depression scores?").
- Identify risk factors (e.g., "Which socioeconomic variables predict child labor in Kathmandu?").
- Advocate for policy changes with data (e.g., "How many households in Chitwan lack access to clean water?").
1. Choosing the Right Test: A Decision Tree
Not all statistical tools answer the same question. Below is a Mermaid flowchart to help select the correct test based on your research question, data type, and variables.
graph TD
    A["Start: What’s your research question?"] --> B["Is it about DIFFERENCES between groups?"]
    B -->|"Yes"| C["Are groups independent (e.g., men vs. women)?"]
    C -->|"Yes"| D["1 variable? Use t-test\n2+ variables? Use ANOVA"]
    C -->|"No (paired samples, e.g., before/after)"| E["Use paired t-test"]
    B -->|"No"| F["Is it about RELATIONSHIPS between variables?"]
    F -->|"Yes"| G["Are variables continuous (e.g., age, income)?"]
    G -->|"Yes"| H["Linear relationship? Use correlation/regression\nNonlinear? Use Spearman’s rho"]
    G -->|"No (categorical data, e.g., yes/no)"| I["Use chi-square test"]
    F -->|"No"| J["Is it about PREDICTION?"]
    J -->|"Yes"| K["Use regression (simple/multiple)"]
2. Key Statistical Tests: Definitions, Examples, and When to Use Them
A. t-tests: Comparing Group Means
What it does: Tests whether the means of two or more groups are significantly different. Types:
- Independent t-test: Compares two unrelated groups (e.g., income of urban vs. rural households).
- Paired t-test: Compares the same group before/after an intervention (e.g., blood pressure of patients before/after a health program).
- One-sample t-test: Compares a sample mean to a known value (e.g., "Is the average family size in Nepal 4, or higher?").
Worked Example: Ncell Customer Satisfaction Ncell wants to know if customers in Pokhara are more satisfied than those in Kathmandu. They survey 100 people in each city (satisfaction scored 1–10).
- Hypothesis: : Mean satisfaction in Pokhara = Mean satisfaction in Kathmandu.
- Test: Independent t-test.
- Steps:
- Calculate means: Pokhara = 7.2, Kathmandu = 6.5.
- Compute t-statistic: (where = pooled standard deviation).
- Compare to critical t-value (df = 198, α = 0.05).
- Result: If , reject . Ncell concludes Pokhara customers are significantly more satisfied.
B. Chi-Square Test: Analyzing Categorical Data
What it does: Tests if there’s a significant association between two categorical variables (e.g., "Does education level affect voting behavior?"). Types:
- Chi-square test of independence: Compares observed vs. expected frequencies in a contingency table.
- Chi-square goodness-of-fit: Tests if sample data matches a population distribution (e.g., "Are NEPSE stock returns evenly distributed across months?").
Worked Example: Daraz Order Delays Daraz wants to know if order delays depend on the day of the week. They track 500 orders:
| Day | Delivered on Time | Delayed |
|---|---|---|
| Monday | 80 | 20 |
| Tuesday | 75 | 25 |
| Wednesday | 60 | 40 |
- Hypothesis: : No association between day and delays.
- Test: Chi-square test of independence.
- Steps:
- Calculate expected frequencies (e.g., for Monday: ).
- Compute .
- Compare to critical (df = 2, α = 0.05 → 5.99).
- Result: If , reject . Daraz concludes delays are not random.
C. Correlation: Measuring Relationship Strength
What it does: Quantifies the strength and direction of a linear relationship between two continuous variables (e.g., "How does income correlate with life satisfaction?"). Key metrics:
- Pearson’s r: For linear relationships (range: -1 to +1).
- Spearman’s rho: For monotonic relationships (non-linear but ordered).
Worked Example: NTC Traffic Congestion NTC collects data on daily traffic volume (X) and average speed (Y) in Kathmandu:
| Traffic Volume (X) | Speed (Y, km/h) |
|---|---|
| 5000 | 20 |
| 8000 | 15 |
| 12000 | 10 |
- Calculation:
- .
- Plugging in values: (strong negative correlation).
- Interpretation: As traffic volume increases, speed decreases sharply.
D. Regression: Predicting Outcomes
What it does: Models the relationship between a dependent variable (Y) and one or more independent variables (X) to predict Y. Types:
- Simple linear regression: One predictor (e.g., "How does study hours predict exam scores?").
- Multiple regression: Multiple predictors (e.g., "How do income, education, and age predict political participation?").
Worked Example: Bank Loan Approval *A bank uses regression to predict loan default risk based on:
- X1: Credit score (0–1000)
- X2: Income (in NPR)
- Y: Probability of default (0–1)*
Regression equation:
Steps:
- Collect data for 100 past loans.
- Use software (e.g., SPSS, Excel) to compute coefficients:
- , , .
- Prediction: For a customer with credit score 700 and income 50,000 NPR: (16% default risk).
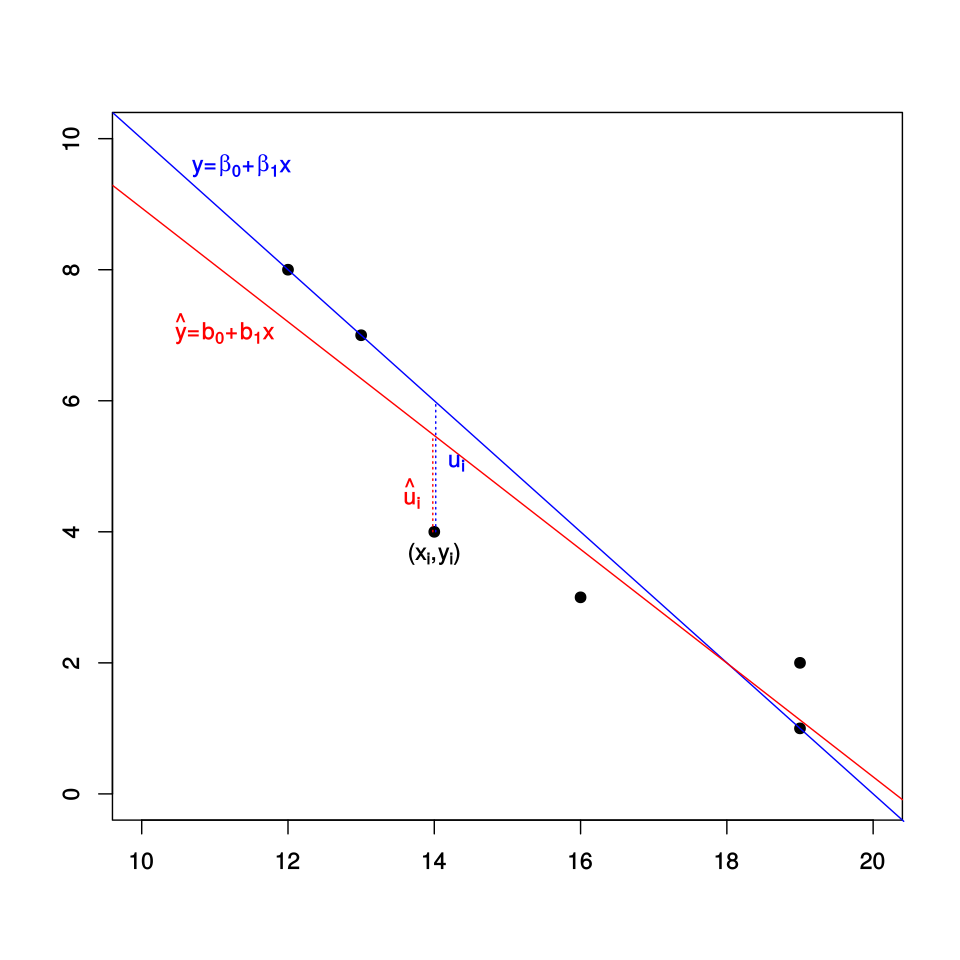 A graph showing a regression line fitted to data points, with residual errors marked and the equation displayed. (Image: Sigbert, CC0, via Wikimedia Commons)
3. Comparing Methods: When to Use Which
| Test | Purpose | Data Type | Example in Nepal | Limitations |
|---|---|---|---|---|
| t-test | Compare group means | Continuous, 2+ groups | Ncell: Satisfaction scores by region | Assumes normality; sensitive to outliers |
| Chi-square | Test association in categories | Categorical | Daraz: Order delays by day | Requires expected frequencies >5 |
| Correlation | Measure relationship strength | Continuous | NTC: Traffic volume vs. speed | Only linear relationships |
| Regression | Predict outcomes | Continuous (Y) + predictors | Bank: Loan default risk | Multicollinearity can distort results |
4. Real-World Applications in Nepal
A. eSewa and Digital Transaction Fraud
- Idea Used: Chi-square test and logistic regression.
- How:
- eSewa analyzes transaction data to detect fraud patterns. For example, they might use a chi-square test to check if fraud rates differ by payment method (e.g., credit card vs. mobile wallet).
- Logistic regression predicts fraud probability based on variables like transaction amount, time, and user location.
- Example: If shows credit card transactions have significantly higher fraud rates, eSewa flags them for review.
B. NEPSE Stock Market Trends
- Idea Used: Time-series regression and correlation.
- How:
- NEPSE uses regression to model stock prices based on macroeconomic indicators (e.g., inflation rate, GDP growth).
- Correlation analysis helps identify which indicators (e.g., fuel prices, remittance inflows) most strongly affect stock performance.
- Example: If between remittance inflows and NEPSE index, investors use this to predict market movements.
C. Pathao Driver Earnings
- Idea Used: ANOVA and multiple regression.
- How:
- Pathao analyzes driver earnings across cities (Kathmandu, Pokhara, Biratnagar) using ANOVA to test if average earnings differ significantly.
- Regression models predict earnings based on factors like:
- X1: Hours worked
- X2: Peak-hour rides
- X3: Vehicle type
- Example: The model might show NPR/hour for peak-hour rides, helping drivers optimize schedules.
5. Ethical Considerations in Quantitative Analysis
Quantitative data can be misused if not handled ethically. Key concerns:
Data Privacy:
- Example: Ncell must anonymize customer data before analyzing satisfaction scores.
- Rule: Comply with Nepal’s Data Privacy Act (2018) and TU’s ethical guidelines.
Avoiding Bias:
- Example: If a bank’s loan approval model uses regression but excludes women’s income data, it reinforces gender bias.
- Solution: Check for omitted variable bias and validate models across subgroups.
Transparency:
- Example: NEPSE must disclose how it calculates stock indices (e.g., which companies are included).
- Rule: Report all assumptions, limitations, and software used (e.g., "Analysis conducted using SPSS v25").
Interpretation:
- Example: A high correlation () between ice cream sales and drowning deaths doesn’t imply causation (both are linked to summer heat).
- Solution: Use causal diagrams to clarify relationships.
6. Step-by-Step: Conducting a Quantitative Analysis
Use this Mermaid timeline to guide your research:
gantt
    title Quantitative Data Analysis Workflow
    dateFormat  YYYY-MM-DD
    section Planning
    Define research question    :a1, 2023-10-01, 3d
    Select statistical test     :a2, after a1, 2d
    section Data Collection
    Gather data                 :b1, 2023-10-06, 5d
    Clean data (handle missing values) :b2, after b1, 2d
    section Analysis
    Run test (e.g., t-test)     :c1, 2023-10-14, 3d
    Interpret p-values          :c2, after c1, 1d
    section Reporting
    Write results               :d1, 2023-10-19, 2d
    Discuss limitations         :d2, after d1, 1d
    note right of a1 :"Research question must be clear and testable"
    note right of b2 :"Missing data >5%? Use imputation"
    note right of c1 :"Check assumptions (normality, homogeneity)"
Key Steps Explained:
Define the Question:
- Example: "Do households in Kavrepalanchok with piped water have lower child mortality rates?"
- Tool: Use the PICO framework (Population, Intervention, Comparison, Outcome).
Select the Test:
- Mortality rates (binary: yes/no) vs. water access (binary) → Chi-square test.
Collect Data:
- Use surveys or secondary data (e.g., WHO health reports).
- IMAGE: survey questionnaire design labelled diagram | A sample questionnaire with sections for demographics, water access, and health outcomes.
Clean Data:
- Handle missing values (e.g., impute or exclude).
- Check for outliers (e.g., a household reporting 20 children).
Analyze:
- Compute . If , conclude piped water reduces mortality.
Report:
- State assumptions (e.g., "Data assumes water access is self-reported").
- Example Output:
"The chi-square test revealed a significant association between piped water access and child mortality (), suggesting water infrastructure programs may save lives."
Exam Tip: How to Score Full Marks
Structure Your Answer:
- Use the IMRaD format (Introduction, Methods, Results, Discussion) even for short answers.
- Example for a t-test question:
Introduction: Briefly state the purpose (e.g., "This study compares..."). Methods: Name the test, state assumptions (e.g., "Data is normally distributed"), and describe calculations. Results: Report test statistic (e.g., ) and effect size (e.g., Cohen’s d). Discussion: Interpret results and limitations (e.g., "Small sample size may limit generalizability").
Show Calculations (When Required):
- For manual questions, write out formulas and plug in numbers.
- Example for correlation:
r = [n(ΣXY) – (ΣX)(ΣY)] / √{[nΣX² – (ΣX)²][nΣY² – (ΣY)²]}
= [5(12000) – (25)(60)] / √{[5(725) – 625][5(420) – 3600]}
= 10000 / √[10000] = 1.0
Use Real-World Examples:
- Examiners love context. Tie your answer to Nepal’s scenarios:
- Bank loan: "Like NMB Bank’s credit scoring model..."
- Health program: "Similar to WHO’s water sanitation studies in Chitwan..."
- Avoid generic examples (e.g., "students’ test scores").
- Examiners love context. Tie your answer to Nepal’s scenarios:
Common Pitfalls to Avoid:
- Misinterpreting p-values: A is not significant (use ).
- Ignoring assumptions: Always state whether data is normal, independent, etc.
- Overgeneralizing: "This applies to all Nepali households" is invalid if your sample is from Kathmandu only.
Visuals in Exams:
- If asked to "describe a test," sketch a simple table or graph (e.g., a bar chart for t-test groups or a scatter plot for correlation).
- Example for chi-square:
|                | Observed | Expected |
|----------------|----------|----------|
| Urban Households| 60       | 50       |
| Rural Households| 40       | 50       |
Practice Question with Model Answer
Question: "A social worker wants to evaluate whether a mental health workshop reduces anxiety levels among adolescents in Lalitpur. She measures anxiety scores (1–10) before and after the workshop for 30 participants. Which statistical test should she use? Justify your choice with calculations and interpret the results if the mean anxiety score drops from 7.2 to 5.8 with a p-value of 0.001."
Model Answer: Test: Paired t-test (same participants measured before/after). Assumptions:
- Data is continuous (anxiety scores).
- Normally distributed (checked via Shapiro-Wilk test).
- No outliers (verified via boxplot).
Calculations:
- Compute mean difference: .
- Standard deviation of differences: .
- t-statistic: .
- Degrees of freedom: .
- Critical t-value (α = 0.05, two-tailed): .
- Since and , reject .
Interpretation: The workshop significantly reduced anxiety (), with a large effect size (Cohen’s d = 1.2). This suggests the program is effective, but further research should test long-term effects and include a control group.
Visual:
graph LR
    A["Before Workshop\nMean = 7.2"] -->|"Participants"| B["After Workshop\nMean = 5.8"]
    B --> C["Paired t-test\np = 0.001"]
    C --> D["Conclusion: Significant reduction"]
Based on the TU BSW syllabus for Research Methods And Academic Writing, unit 5.
Discussion
Loading…