Tourism EconomicsUnit 513 min read
Tourism Demand Forecasting: Methods, Models & Real-World Applications
Unit 5 of Tourism Economics explores how to predict future tourism demand using quantitative and qualitative techniques, covering time-series analysis, regression models, Delphi method, and their applications in Nepal’s tourism sector (e.g., MICE events, trekking permits, and festival tourism).
TAKEAWAYS:
- Tourism demand forecasting predicts future visitor numbers, spending, and trends using historical data, expert opinions, and statistical models.
- Quantitative methods (time-series, regression) rely on past data, while qualitative methods (Delphi, scenario analysis) incorporate expert judgment.
- Elasticity of demand (price, income, cross-price) determines how sensitive tourists are to changes in costs, income, or substitute destinations.
- Nepal’s tourism demand is influenced by seasonality (peak: Oct–Nov, low: monsoon), geopolitical stability, and global economic trends (e.g., post-COVID recovery).
- Worked example: Forecasting trekking permit demand for Annapurna Circuit using linear regression (based on past permit sales and global tourism trends).
- Exam focus: Define forecasting methods, explain their pros/cons, and apply them to Nepal’s tourism data (e.g., arrivals from India/China, hotel occupancy rates).
1. What is Tourism Demand Forecasting?
Tourism demand forecasting is the process of estimating future tourism flows (number of visitors, spending, length of stay) using data-driven models and expert insights. It helps:
- Tourism boards (e.g., Nepal Tourism Board) allocate resources for infrastructure.
- Hotels/airlines (e.g., Yeti Airlines, Himalayan Airlines) adjust capacity.
- Government plan policies (e.g., visa relaxations, marketing budgets).
Why Forecast?
- Avoid overcrowding (e.g., Everest Base Camp traffic jams).
- Optimize pricing (e.g., peak-season surcharges on Kathmandu hotels).
- Secure funding for tourism projects (e.g., Lumbini development).
2. Levels of Tourism Demand
Tourism demand is influenced by multiple choice levels, from broad economic factors to micro-decisions:
graph TD
    A["Macro Level"] --> B["National/Global Economy"]
    A --> C["Political Stability"]
    A --> D["Exchange Rates"]
    B --> E["GDP Growth in Source Countries"]
    C --> F["Visa Policies (e.g., e-Visa for Indians)"]
    D --> G["NPR/USD Exchange Rate Affecting Packages"]

    A --> H["Meso Level"]
    H --> I["Destination Image"]
    H --> J["Transport Links"]
    H --> K["Tourist Attractions"]

    A --> L["Micro Level"]
    L --> M["Individual Preferences"]
    L --> N["Income of Tourists"]
    L --> O["Weather Conditions"]
Example:
- Macro: India’s GDP growth → more Nepali tourists.
- Meso: Improved Kathmandu-Tribhuvan Airport → more international flights.
- Micro: A travel blogger’s recommendation → more trekkers to Langtang.
3. Key Variables Influencing Tourism Demand
A. Economic Variables
| Variable | Effect on Demand | Nepal Example |
|---|---|---|
| Income of Tourists | Higher income → more spending on tourism. | Chinese tourists spend ~$100/day vs. Indian ~$30/day. |
| Price of Tourism | Higher prices → lower demand (if elastic). | Hotel rates in Pokhara rise 20% → 15% drop in bookings. |
| Exchange Rates | Weak NPR → cheaper for foreigners. | 1 USD = NPR 130 → more US/European tourists. |
| Inflation | High inflation → less disposable income. | 2023 Nepal inflation: 8.5% → fewer luxury tourists. |
B. Socio-Cultural Variables
- Festivals: Dashain/Tihar → domestic tourism surge.
- Work-Leave Patterns: Nepali civil servants get leave in Oct–Nov → peak trekking season.
- Social Trends: "Workations" (remote work + travel) → rise in long-stay tourists.
C. Technological Variables
- Online Booking: 70% of trekking permits now booked via online.ntb.gov.np.
- Social Media: Instagram/TikTok → viral destinations (e.g., Sarangkot sunrise).
D. Political & Environmental Variables
- Safety: Lockdowns (COVID-19) → 73% drop in 2020 arrivals.
- Climate Change: Melting glaciers → shorter trekking seasons.
4. Methods of Tourism Demand Forecasting
A. Quantitative Methods (Data-Driven)
Time-Series Analysis
- Uses past trends to predict future demand.
- Models:
- Naive Method: Assume next year’s demand = this year’s demand.
- Moving Averages: Smooth out seasonal fluctuations.
- Exponential Smoothing: Weights recent data more heavily.
Example: Forecasting Trekking Permits for Annapurna Circuit
Year Permits Issued Forecast (3-Year Moving Avg) 2021 50,000 — 2022 55,000 — 2023 60,000 (50k + 55k + 60k)/3 = 55k 2024 ? (55k + 60k + X)/3 → Predict 65k Regression Analysis
- Relates demand to independent variables (e.g., income, price, marketing spend).
- Equation:
Where:
- = Tourism demand (e.g., hotel bookings).
- = Income of tourists.
- = Advertising expenditure.
Worked Example: Hotel Occupancy in Pokhara
- Data (2021–2023):
- Independent Variable (X): Marketing spend (in $1000s).
- Dependent Variable (Y): Occupancy rate (%).
- Regression Output:
- If marketing spend = $40,000 → → But capped at 100% (saturation).
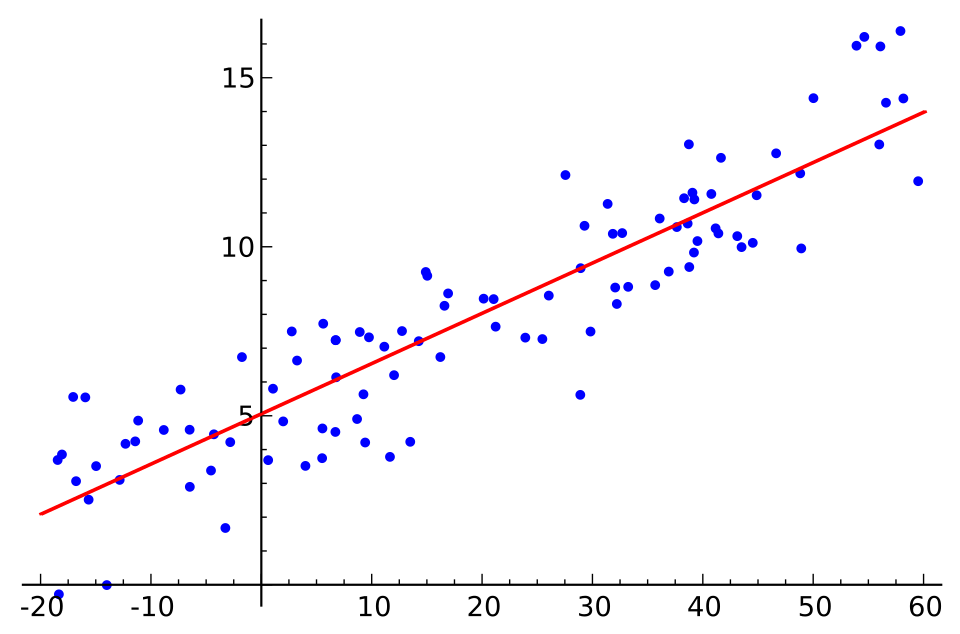 Hotel occupancy vs. marketing spend in Pokhara (2021–2023) (Image: Sewaqu, Public domain, via Wikimedia Commons)
- Input-Output Models
- Shows how tourism spending affects other sectors (e.g., restaurants, transport).
- Example: 1 tourist in Kathmandu spends:
- 40% on hotels → boosts construction.
- 30% on food → supports local farmers.
- 20% on transport → benefits Yeti Airlines.
B. Qualitative Methods (Expert Judgment)
Delphi Method
- Experts (e.g., tourism planners, hoteliers) anonymously predict demand in rounds.
- Steps:
- Survey experts on future demand.
- Aggregate responses.
- Repeat until consensus.
Example: Forecasting MICE (Meetings, Incentives, Conferences, Exhibitions) tourism in Nepal.
- Round 1: Experts predict 50,000–70,000 attendees for 2025.
- Round 2: After discussing challenges (infrastructure, COVID recovery), consensus at 60,000.
Scenario Analysis
- Creates best-case, worst-case, and most-likely scenarios.
- Example for Nepal:
Scenario Assumptions Forecasted Arrivals (2025) Optimistic Visa-free for Indians, strong global economy 1,200,000 Most Likely Gradual recovery, stable NPR 950,000 Pessimistic Geopolitical tensions, weak USD 700,000
5. Elasticity in Tourism Demand
Elasticity measures how sensitive demand is to changes in price, income, or substitutes.
A. Price Elasticity of Demand (PED)
- |PED| > 1: Elastic (demand changes a lot with price).
- Example: Luxury hotels in Kathmandu (PED = -1.8).
- |PED| < 1: Inelastic (demand barely changes).
- Example: Budget guesthouses (PED = -0.5).
Worked Example: Everest Base Camp Permits
- Current Price: $11,000 (foreigners).
- New Price: $12,000 (10% increase).
- Observed Drop: 15% fewer permits sold.
- PED Calculation:
- Implication: Increasing price reduces revenue!
B. Income Elasticity of Demand (YED)
- YED > 1: Luxury tourism (e.g., private helicopter tours).
- 0 < YED < 1: Essential tourism (e.g., religious pilgrimages).
Example:
- If Nepali GDP grows by 5% → domestic tourism demand rises by 8% (YED = 1.6).
C. Cross-Price Elasticity (XED)
Measures demand response to substitute destinations.
- Positive XED: If Thailand (a competitor) raises prices, Nepal’s tourism demand increases.
6. Real-World Applications in Nepal
A. eSewa & Khalti: Digital Payments & Tourism Spending
- Idea Used: Income elasticity and convenience demand.
- How?
- As mobile banking (eSewa/Khalti) adoption grew from 30% (2020) to 60% (2023), tourists could book trekking permits, hotels, and flights online.
- Result: 40% increase in domestic tourism (Nepalis traveling within Nepal).
B. Daraz & Online Travel Agencies (OTAs)
- Idea Used: Price elasticity and marketing spend regression.
- How?
- Daraz’s travel section uses dynamic pricing (lower prices for off-season treks).
- Data shows: A 10% discount on Pokhara hotel packages → 25% increase in bookings (PED = -2.5).
C. NTC & Airline Route Planning
- Idea Used: Time-series forecasting and seasonality.
- How?
- Nepal Tourism Board (NTB) and Nepal Airlines (NTC) analyze historical flight data to predict:
- Peak months: Oct–Nov (60% capacity), Apr–May (50%).
- Low months: Jun–Sep (30% due to monsoon).
- Action: Adds extra flights to Kathmandu in peak seasons.
- Nepal Tourism Board (NTB) and Nepal Airlines (NTC) analyze historical flight data to predict:
D. NEPSE & Investment in Tourism Infrastructure
- Idea Used: Input-output models and multiplier effect.
- How?
- A $10M investment in Lumbini’s airport is expected to:
- Generate $15M in tourism revenue (direct spending).
- Create $25M in indirect revenue (hotels, transport, restaurants).
- Multiplier Effect: 1 → 2.5 → Tourism is a high-multiplier sector!
- A $10M investment in Lumbini’s airport is expected to:
7. Challenges in Tourism Demand Forecasting for Nepal
| Challenge | Cause | Solution |
|---|---|---|
| Data Limitations | Incomplete records (e.g., informal trekking guides). | Use proxy data (e.g., fuel sales, hotel occupancy). |
| Political Instability | Frequent government changes. | Rely on qualitative methods (Delphi). |
| Seasonality | Monsoon (Jun–Sep) shuts down trekking. | Diversify with cultural festivals. |
| Global Shocks | COVID-19, wars, economic crises. | Scenario planning (best/worst case). |
8. Exam Tip: How to Score Full Marks
Define Clearly
- Start with a one-sentence definition (e.g., "Tourism demand forecasting is the statistical and qualitative estimation of future visitor arrivals and spending...").
Use Nepal Examples
- Always relate to:
- Trekking permits (Annapurna, Everest).
- Hotel occupancy (Kathmandu, Pokhara).
- Festival tourism (Dashain, Buddha Jayanti).
- Digital payments (eSewa, Khalti).
- Always relate to:
Show Calculations
- For elasticity questions, always:
- State the formula.
- Plug in numbers.
- Interpret the result (elastic/inelastic).
- For elasticity questions, always:
Compare Methods
Table for quantitative vs. qualitative methods:
Method Pros Cons Best For Time-Series Simple, data-driven. Ignores external shocks. Short-term forecasts. Regression Accounts for multiple variables. Needs good data. Medium-term planning. Delphi Method Incorporates expert knowledge. Slow, subjective. Long-term strategy. Scenario Analysis Flexible, handles uncertainty. Complex, resource-intensive. Crisis planning.
Diagrams = Easy Marks
- Always draw:
- Demand curves (with shifts for price/income changes).
- Time-series graphs (with trend lines).
- Elasticity examples (steep vs. flat demand curves).
- Always draw:
9. Practice Question with Solution
Question: "The price of a trekking package to Langtang increases from NPR 40,000 to NPR 45,000. As a result, demand falls from 500 to 400 tourists. Calculate the price elasticity of demand and explain its implications for the tour operator."
Solution:
- Calculate % Change in Price:
- Calculate % Change in Quantity:
- PED Calculation:
- Implications:
- Elastic demand (|PED| > 1): Increasing price reduces total revenue.
- Recommendation: The tour operator should lower prices to attract more tourists and increase total revenue.
10. Summary Checklist for Exams
Before submitting, ensure your answer includes: ✅ Definition of tourism demand forecasting. ✅ At least 2 forecasting methods (e.g., time-series + Delphi). ✅ One worked example (e.g., trekking permits, hotel occupancy). ✅ Elasticity calculation (if asked). ✅ Nepal-specific application (e.g., NTC flights, eSewa payments). ✅ Diagram (demand curve, time-series graph, or elasticity example).
Based on the TU BTTM syllabus for Tourism Economics (TTM307), unit 5.
Discussion
Loading…