StatisticsUnit 36 min read
Measures of Dispersion – Range, Quartile Deviation, SD, CV
Unit 3 of Statistics: This note explains the concepts, formulas, and applications of Range, Quartile Deviation, Standard Deviation, and Coefficient of Variation, with worked examples and real‑world relevance for tourism data.
Key points
- Range gives the simplest spread but is sensitive to outliers.
- Quartile Deviation (semi‑interquartile range) focuses on the middle 50 % of data.
- Standard Deviation measures average deviation from the mean and is the most widely used dispersion metric.
- Coefficient of Variation normalises SD by the mean, enabling comparison across units.
- All four measures are essential for assessing variability in tourism statistics, financial risk, and service quality.
Introduction
Dispersion measures describe how data points spread around a central value. While the mean or median tells us where the centre lies, dispersion tells us how tightly or loosely the data cluster. In tourism, dispersion informs us about the consistency of visitor arrivals, price stability, or service quality across destinations.
Range
Definition
The range is the difference between the largest and smallest values in a data set.
How it works
- Quick to compute.
- Sensitive to extreme values; a single outlier can inflate the range.
Worked example
Tourist arrivals (thousands) for a month:
Visual – Histogram of the data
Quartile Deviation (Semi‑Interquartile Range)
Definition
The quartile deviation (QD) is half the interquartile range (IQR), measuring the spread of the middle 50 % of data.
How it works
- Less affected by outliers than range.
- Useful when data are skewed.
Worked example
Given and :
Visual – Box plot showing quartiles
Standard Deviation (SD)
Definition
Standard deviation quantifies the average distance of each observation from the mean.
For sample data use in the denominator.
How it works
- Provides a single number in the same units as the data.
- Widely used in risk assessment, quality control, and forecasting.
Worked example
Using the tourist arrival data:
Compute squared deviations:
Sum = .
Population SD:
Visual – Bar chart of SD for three tourism sectors
Mermeid diagram – Steps to compute SD
flowchart TD
    "Collect Data" --> "Compute Mean"
    "Compute Mean" --> "Subtract Mean from Each Observation"
    "Subtract Mean" --> "Square Each Difference"
    "Square Differences" --> "Sum All Squared Differences"
    "Sum Squared Differences" --> "Divide by n (or n-1)"
    "Divide" --> "Take Square Root"
    "Result" --> "Standard Deviation"
Coefficient of Variation (CV)
Definition
CV expresses dispersion relative to the mean, enabling comparison across different scales.
How it works
- Dimensionless percentage.
- Useful for comparing variability of prices, arrival rates, or service times.
Worked example 1 – Given mean and variance
Mean , variance .
Worked example 2 – Given CV and SD
CV , SD .
Mean = 4.
Mode cannot be determined from CV and SD alone.
Visual – Line plot of CV across months for a hotel chain
Comparison Table of Dispersion Measures
| Measure | Formula | Sensitivity to Outliers | Units | Typical Use |
|---|---|---|---|---|
| Range | High | Same as data | Quick check of spread | |
| Quartile Deviation | Low | Same as data | Robust middle‑50 % spread | |
| Standard Deviation | Moderate | Same as data | Statistical inference, risk | |
| Coefficient of Variation | Moderate | % | Compare across units |
Advantages, Disadvantages, and Applications
| Measure | Advantages | Disadvantages | Applications in Tourism |
|---|---|---|---|
| Range | Simple, fast | Skewed by extremes | Quick assessment of price range for packages |
| Quartile Deviation | Robust to outliers | Requires quartiles | Evaluating consistency of daily visitor counts |
| Standard Deviation | Widely accepted, supports inference | Sensitive to outliers | Forecasting demand, setting safety stock for hotels |
| Coefficient of Variation | Unit‑free, comparative | Requires non‑zero mean | Comparing price volatility across destinations |
In the real world
- eSewa – Uses standard deviation of transaction amounts to detect anomalous payments. A sudden spike in SD signals potential fraud.
- Daraz – Calculates coefficient of variation for product prices to identify categories with high price volatility, guiding dynamic pricing strategies.
- Ncell – Measures SD of call drop rates across network towers; a high SD indicates inconsistent coverage requiring infrastructure upgrades.
Exam tip
- Know the formulas: memorize the expressions for range, QD, SD, and CV.
- Practice with sample data: compute all four measures for a small data set; this will help you answer multi‑step questions quickly.
- Interpret results: exam questions often ask you to explain what a large or small CV indicates about the data.
- Check units: SD and CV must be reported in the same units as the data (or as a percentage for CV).
Summary
Dispersion measures transform raw data into meaningful insights about variability. Range offers a quick glance, QD gives a robust middle‑spread, SD provides a comprehensive spread metric, and CV normalises dispersion for cross‑scale comparison. Mastering these concepts equips tourism students to analyze visitor patterns, price stability, and service quality, all of which are critical for strategic decision‑making in Nepal’s growing tourism sector.
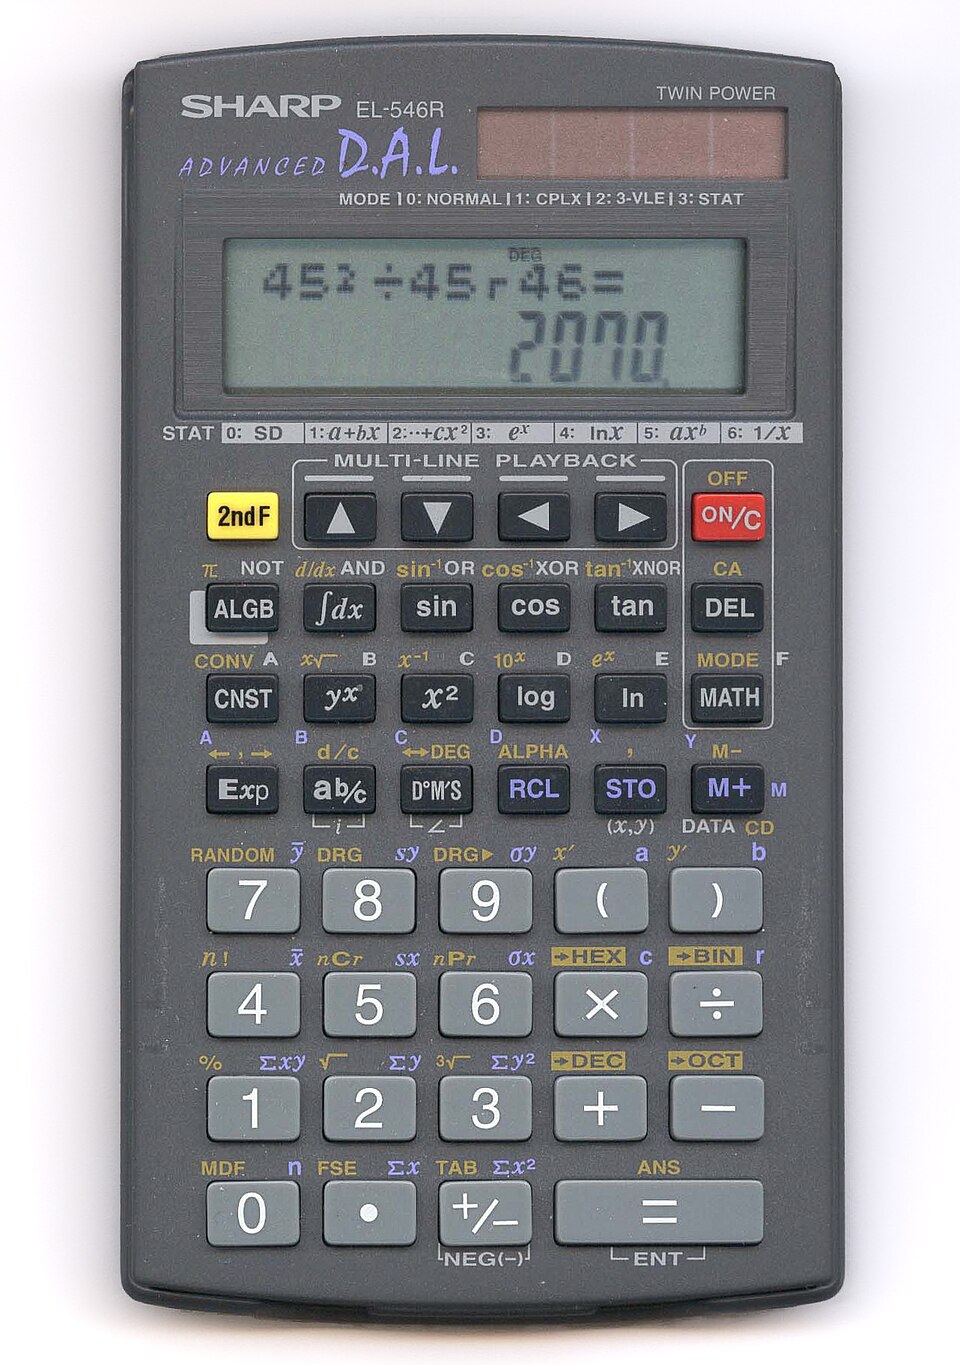 Calculator used for computing standard deviation (Image: Matti Blume, CC BY-SA 2.0, via Wikimedia Commons)
Based on the TU BTTM syllabus for Statistics (STT301), unit 3.
Discussion
Loading…