EconomicsUnit 811 min read
Cost & Revenue: Types, Short/Long Run, Profit Maximization
Unit 8 of Economics explains how businesses calculate costs (fixed, variable, total, average, marginal) and revenues (total, average, marginal), how they change in the short vs. long run, and how firms decide production levels to maximize profit—with real-world examples and NEB-style questions.
TAKEAWAYS:
- Costs are divided into fixed (do not change with output) and variable (change with output), and their averages/marginals are key tools for decision-making.
- Revenue is split into total, average, and marginal revenue, with marginal revenue showing how extra output affects total revenue.
- In the short run, at least one factor of production is fixed; in the long run, all factors are variable.
- Firms maximize profit where MR = MC (marginal revenue equals marginal cost).
- Shutdown rule: A firm should stop production if price < average variable cost (P < AVC).
- Break-even point occurs where total revenue equals total cost (TR = TC), and firms earn normal profit.
1. Introduction to Costs
Costs are the expenses a business incurs to produce goods and services. They can be classified into two main types:
1.1 Fixed Costs (FC)
- Definition: Costs that do not change with the level of production in the short run.
- Examples:
- Rent of factory
- Salaries of permanent workers
- Insurance premiums
- Interest on loans
- Graph: Fixed costs remain constant regardless of output.
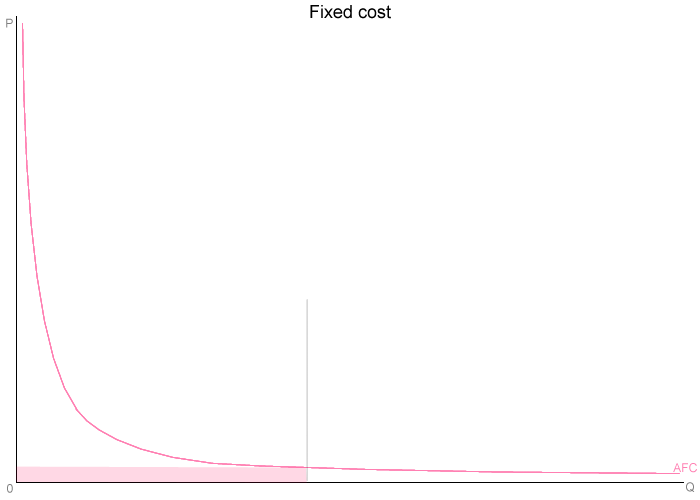 A horizontal line showing FC = $100 at all output levels (0 to 10 units) (Image: The original uploader was Yunzhong Hou at English Wikibooks., CC BY-SA 2.0, via Wikimedia Commons)
#### **1.2 Variable Costs (VC)**
- **Definition**: Costs that **change** with the level of production.
- **Examples**:
- Raw materials
- Wages of temporary workers
- Electricity bills
- Packaging costs
- **Graph**: Variable costs **increase** as output increases.
#### **1.3 Total Cost (TC)**
- **Definition**: The **sum of fixed and variable costs** at any level of production.
- **Example**:
If FC = $100 and VC = $200 at 5 units of output, then:
---
### **2. Average and Marginal Costs**
```figure
{"type":"curves","lines":[{"label":"AFC","fn":true,"expr":"100/x","from":[1,100],"to":[10,10]},{"label":"AVC","fn":true,"expr":"0.1*x^2 - 2*x + 50","from":[1,48],"to":[10,130]},{"label":"ATC","fn":true,"expr":"0.1*x^2 - x + 150","from":[1,158],"to":[10,140]},{"label":"MC","fn":true,"expr":"0.2*x - 2","from":[1,-1.8],"to":[10,0.2]}],"points":[{"x":5,"y":20,"label":"AFC min"},{"x":5,"y":47.5,"label":"MC = ATC (Q=5)"},{"x":5,"y":125,"label":"ATC min"}],"xlabel":"Quantity (Units)","ylabel":"Cost ($/unit)","caption":"Cost curves showing AFC declining, AVC and MC U-shaped, and MC intersecting ATC at its minimum"}
2.1 Average Fixed Cost (AFC)
- Definition: Fixed cost per unit of output.
- Graph: AFC falls as output increases (spreading effect).
2.2 Average Variable Cost (AVC)
- Definition: Variable cost per unit of output.
- Graph: AVC first falls, then rises (due to diminishing returns).
2.3 Average Total Cost (ATC)
- Definition: Total cost per unit of output.
- Graph: ATC is U-shaped (sum of AFC and AVC).
2.4 Marginal Cost (MC)
- Definition: The additional cost of producing one more unit.
- Graph: MC cuts ATC at its minimum point.
Why does MC cut ATC at its minimum?
- When MC < ATC, ATC falls.
- When MC > ATC, ATC rises.
- At the minimum point of ATC, MC = ATC.
3. Short Run vs. Long Run Costs
| Feature | Short Run | Long Run |
|---|---|---|
| Time Period | Less than 1 year | More than 1 year |
| Fixed Factors | At least one factor is fixed (e.g., factory size) | All factors are variable (e.g., new technology, plant expansion) |
| Cost Curves | U-shaped ATC, AVC, MC | All costs are variable; no fixed costs |
| Economies of Scale | Not possible (fixed factors limit) | Possible (larger scale = lower per-unit costs) |
| Example | Hiring more workers in the same factory | Building a new factory or adopting new machinery |
Why does the long run matter?
- Firms can adjust all inputs (e.g., expand factory, hire more workers, adopt new tech).
- Long-run ATC curve is flatter than short-run ATC (due to economies of scale).
4. Revenue Concepts
Revenue is the total income a firm earns from selling goods/services.
4.1 Total Revenue (TR)
- Definition: Total money received from selling all units.
- Example: If a firm sells 10 units at $5 each:
4.2 Average Revenue (AR)
- Definition: Revenue per unit sold.
- Graph: AR is a horizontal line in perfect competition (price taker).
4.3 Marginal Revenue (MR)
- Definition: The additional revenue from selling one more unit.
- Graph:
- In perfect competition, MR = AR = Price (horizontal line).
- In monopoly, MR falls as more units are sold (downward-sloping).
Key Difference:
| Market Structure | AR (Price) | MR |
|---|---|---|
| Perfect Competition | Horizontal line | Same as AR (horizontal) |
| Monopoly | Downward-sloping | Below AR, steeper slope |
5. Profit Maximization
Firms aim to maximize profit, which is: Rule for Profit Maximization: A firm maximizes profit where: Why?
- If MR > MC, producing more increases profit.
- If MR < MC, producing less increases profit.
- At MR = MC, profit is maximized.
Example:
| Q | TR | TC | MR | MC | Profit (TR - TC) |
|---|---|---|---|---|---|
| 1 | 10 | 5 | 10 | 5 | 5 |
| 2 | 25 | 12 | 15 | 7 | 13 |
| 3 | 35 | 22 | 10 | 10 | 13 |
| 4 | 40 | 35 | 5 | 13 | 5 |
Analysis:
- At Q=3, MR (10) = MC (10) → Profit is maximized ($13).
- At Q=2, MR (15) > MC (7) → Increase output.
- At Q=4, MR (5) < MC (13) → Decrease output.
6. Shutdown Rule
A firm should stop production if: Why?
- If price is below AVC, the firm loses more by producing than by shutting down.
- It can cover variable costs and part of fixed costs by shutting down.
Example:
- If AVC = $4 and P = $3, the firm should shut down (losing $1 per unit).
- If AVC = $4 and P = $5, the firm should continue (making $1 per unit).
7. Break-Even Point
The break-even point is where: At this point:
- The firm covers all costs but earns zero economic profit.
- It is the minimum point where the firm can operate without loss.
Graphical Representation:
Exam Tip: How to Score Full Marks
- Understand the difference between short run and long run – Always mention whether the question is about short-run or long-run costs.
- Draw cost curves correctly – Label FC, VC, TC, MC, ATC, AVC properly. Show MC cutting ATC at its minimum.
- Apply MR = MC rule – Always check if the question asks for profit maximization and solve using this rule.
- Shutdown vs. Continue – Remember:
- If P > AVC, continue producing.
- If P < AVC, shut down.
- Numerical Problems – Practice calculating TC, ATC, MC, TR, MR, and profit from given data.
- Real-World Examples – Relate concepts to Nepalese businesses (e.g., tea factories, hydropower projects).
NEB Board-Style Questions (Practice)
Short Answer Questions
Define:
- (a) Fixed Cost
- (b) Marginal Cost
- (c) Break-Even Point
Distinguish between:
- (a) Short-run and Long-run costs
- (b) Average Revenue and Marginal Revenue
Why is the MC curve U-shaped?
Long Answer Questions
Explain the relationship between MC and ATC with a diagram. Why does MC cut ATC at its minimum point?
A firm has the following cost data:
Q FC VC 1 50 20 2 50 35 3 50 55 4 50 80 - Calculate TC, ATC, AVC, and MC for each output level.
- At what quantity does the firm maximize profit if the market price is $25?
What is the shutdown rule? When should a firm continue production despite making losses?
Diagram-Based Questions
Draw a cost curve showing FC, VC, TC, MC, ATC, and AVC. Label the minimum points of ATC and AVC.
Draw a graph to show the break-even point. What happens if the firm produces beyond this point?
Good luck with your NEB exam preparation! 🚀
Based on the NEB +2 Humanities syllabus for Economics (Eco), unit 8.
Discussion
Loading…