EconomicsUnit 1016 min read
Economic Growth vs Development: Measures, Models & Nepal’s Path
Unit 10 of Economics explains the difference between economic growth and development, their measurement tools (GDP, HDI, etc.), theories (Harrod-Domar, Rostow), and Nepal’s growth challenges like agriculture dependence, trade deficits, and human resource gaps.
TAKEAWAYS:
- Growth ≠ Development: Growth is about GDP increase; development includes human well-being (health, education, equality).
- Key Measures: GDP per capita, HDI (Human Development Index), Gini coefficient, and PQLI (Physical Quality of Life Index) show different aspects of progress.
- Theories Matter: Harrod-Domar focuses on capital investment, while Rostow’s stages explain how countries develop over time.
- Nepal’s Struggles: High poverty, low industrialization, and trade imbalances slow development despite GDP growth.
- Policy Tools: Education, healthcare, and infrastructure investments are critical for sustainable development.
- Global Link: Foreign aid and trade policies (like Nepal’s reliance on India/China) shape growth trajectories.
1. Economic Growth vs. Economic Development: The Core Difference
Economic growth and development are often used interchangeably, but they are not the same. Let’s break them down:
mindmap
  root((Economic Growth & Development))
    Growth
      Definition: Increase in **real GDP** over time
      Focus: Quantity (more goods/services)
      Measure: GDP per capita, GNP
      Limitation: Ignores inequality, environment, or human well-being
    Development
      Definition: Improvement in **quality of life** (health, education, equality)
      Focus: Sustainability, equity, and human welfare
      Measure: HDI, PQLI, Gini coefficient
      Limitation: Hard to quantify; subjective indicators
    Key Difference
      Growth = "Bigger pie"
      Development = "Fairer, healthier pie for all"
Why does this matter?
- A country can grow (e.g., GDP rises) but still have poor healthcare or high inequality → not developed.
- Example: China has high GDP growth but faces pollution and urban-rural divides.
2. Measuring Economic Growth and Development
A. Growth Measures (Quantitative)
These show economic size but not well-being.
| Indicator | What It Measures | Limitations | Example (Nepal) |
|---|---|---|---|
| GDP (Gross Domestic Product) | Total market value of goods/services in a year | Doesn’t account for inequality or underground economy | Nepal’s GDP: ~$35 billion (2023) |
| GDP per capita | Average income per person | Hides wealth distribution (rich vs. poor) | Nepal: ~$1,200 (2023) |
| GNP (Gross National Product) | GDP + income from abroad (e.g., Nepali workers in India) | Overstates income if many citizens work overseas | Rarely used in Nepal’s reports |
| GNP per capita | Average income including foreign earnings | Similar to GDP per capita for Nepal | ~$1,300 (2023) |
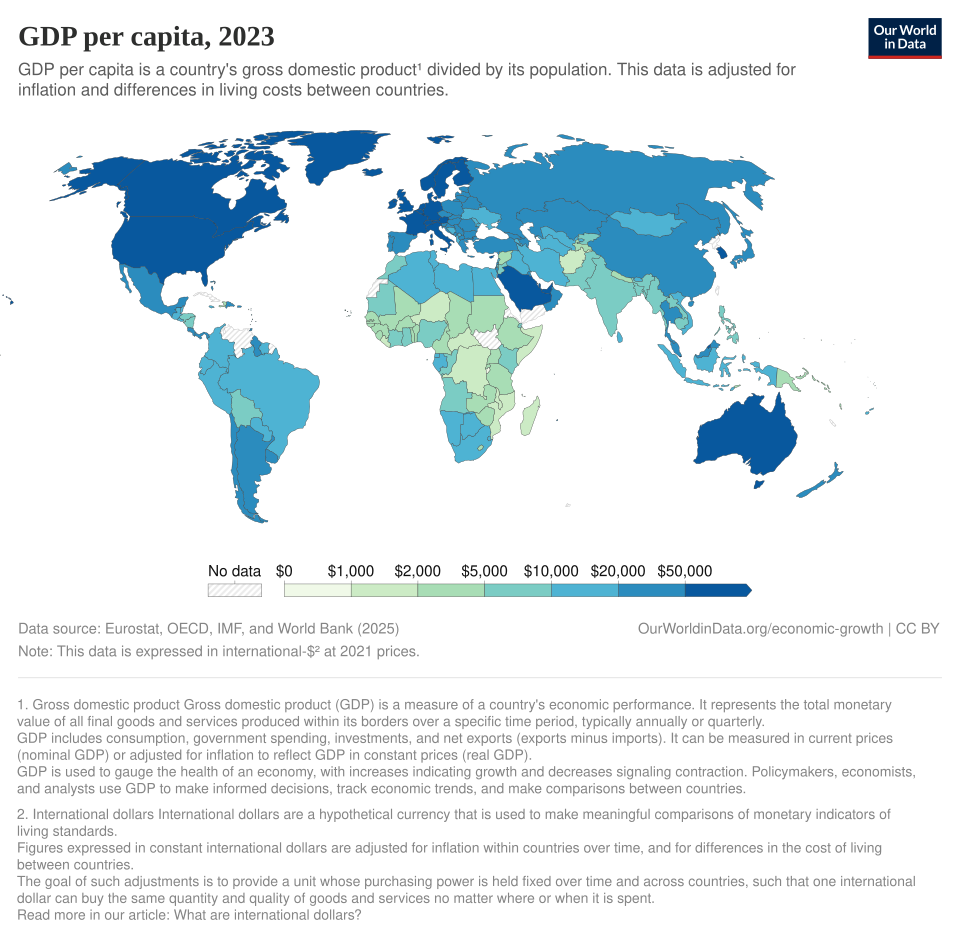 Global GDP per capita comparison (2023) (Image: Our World In Data, CC BY 4.0, via Wikimedia Commons)
(Note: Highlight Nepal’s position among South Asian neighbors like India and Bangladesh.)
Global GDP per capita comparison (2023) (Image: Our World In Data, CC BY 4.0, via Wikimedia Commons)
(Note: Highlight Nepal’s position among South Asian neighbors like India and Bangladesh.)
B. Development Measures (Qualitative + Quantitative)
These show human well-being.
| Indicator | Components | How It’s Calculated | Nepal’s Score (2022) |
|---|---|---|---|
| HDI (Human Development Index) | Life expectancy, education, income | 0 (low) to 1 (high) | 0.594 (Medium human development) |
| PQLI (Physical Quality of Life Index) | Life expectancy, literacy, infant mortality | 0 (worst) to 100 (best) | ~50 (1990s data; outdated but illustrative) |
| Gini Coefficient | Income inequality (0 = perfect equality, 1 = max inequality) | Survey-based data on wealth distribution | ~0.34 (high inequality) |
| Multidimensional Poverty Index (MPI) | Health, education, living standards | % of population poor in 3+ dimensions | 23.6% (2022) |
Why HDI is better than GDP:
- GDP can rise if a few become rich while most stay poor (e.g., oil-rich but unequal countries).
- HDI includes health (life expectancy) and education (school years), which matter more for people’s lives.
SOLVED EXAMPLE 1: Comparing Growth and Development Country X has:
- GDP per capita: $5,000 (high growth)
- HDI: 0.45 (low development)
- Life expectancy: 60 years
- Literacy rate: 40%
Country Y has:
- GDP per capita: $3,000 (moderate growth)
- HDI: 0.75 (high development)
- Life expectancy: 75 years
- Literacy rate: 90%
Question: Which country is more "developed"? Why? Answer: Country Y is more developed because HDI, life expectancy, and literacy are higher. Even though its GDP per capita is lower, its people live longer and are better educated → development > growth alone.
3. Theories Explaining Growth and Development
A. Harrod-Domar Model (Capital-Led Growth)
Key Idea: Growth depends on saving and investment.
- Formula:
- Savings Ratio: % of income saved (e.g., 20% of GDP).
- Capital-Output Ratio: How much capital ($) needed to produce 1 unit of output (e.g., $4 to make $1 of goods).
Example: If Nepal saves 15% of GDP and needs $5 to produce $1 of output:
Limitations:
- Assumes full employment (but Nepal has underemployment in agriculture).
- Ignores technology (e.g., digital economy, renewable energy).
- Policy implication: Nepal needs to increase savings (e.g., via taxes, foreign aid) or reduce capital costs (e.g., cheaper loans for farmers).
(Show a line graph with "Savings Ratio" on X-axis and "Growth Rate" on Y-axis, with Nepal’s hypothetical data.)
B. Rostow’s Stages of Economic Growth
Rostow argued that all economies pass through 5 stages to develop:
flowchart LR
  A["1. Traditional Society"] --> B["2. Preconditions for Take-off"]
  B --> C["3. Take-off"]
  C --> D["4. Drive to Maturity"]
  D --> E["5. Age of High Mass Consumption"]
| Stage | Description | Example Countries | Nepal’s Stage? |
|---|---|---|---|
| 1. Traditional Society | Agriculture-based, low tech, slow growth | Pre-industrial Europe, Nepal (pre-1950s) | Partially (still 60% agrarian) |
| 2. Preconditions | Infrastructure (roads, education), surplus labor moves to cities | Nepal (1960s–1990s) | Transitioning |
| 3. Take-off | Industrialization begins, manufacturing grows | South Korea (1960s) | Struggling (low industry) |
| 4. Drive to Maturity | Tech advancements, diversified economy | China (1990s–present) | Not yet |
| 5. High Consumption | High income, service-based economy (e.g., finance, healthcare) | USA, Japan, Germany | Far away |
Criticism of Rostow:
- Eurocentric: Assumes all countries follow Western paths (ignores colonialism, culture).
- Ignores crises: Wars, pandemics, or bad policies can stall progress (e.g., Nepal’s 1996–2006 civil war).
SOLVED EXAMPLE 2: Where Is Nepal? Using Rostow’s stages, classify Nepal’s economy today. Answer: Nepal is between Stage 1 and 2:
- Stage 1 traits: 60% of people work in agriculture (traditional).
- Stage 2 traits: Some urbanization (Kathmandu, Pokhara), but weak industry and poor infrastructure (e.g., unreliable electricity, bad roads).
- Missing: A strong "take-off" (e.g., no major manufacturing sector like textiles or tech).
4. Nepal’s Growth and Development Challenges
Nepal’s economy has grown (~5–7% annually), but development lags. Why?
A. Structural Problems
| Issue | Impact on Growth/Development | Example in Nepal |
|---|---|---|
| Agriculture Dominance | 60% of workforce in farming; low productivity | Yields: 1.5 tons/hectare (vs. 5+ in India) |
| Trade Deficit | Imports > exports → drains foreign exchange | Nepal imports 80% of oil, medicine, machinery |
| Brain Drain | Skilled workers (doctors, engineers) leave for jobs abroad | 1 million+ Nepalis work in India/Malaysia |
| Infrastructure Gaps | Poor roads, electricity cuts, limited internet | Only 50% of rural areas have reliable power |
| Political Instability | Frequent government changes → unclear policies | 27 constitutions in 27 years! |
B. Human Resource Issues
- Education: Only 60% of children complete secondary school.
- Health: Life expectancy = 70 years (vs. 75 in India), high maternal mortality.
- Gender Gap: Women earn 30% less than men; low political representation.
SOLVED EXAMPLE 3: Why Do Remittances Help Growth but Not Development? Remittances (money sent home by Nepalis abroad) make up 25% of Nepal’s GDP. Answer:
- Helps Growth: More money → higher GDP (people spend on imports).
- Hurts Development:
- Brain drain: Best workers leave (e.g., nurses, engineers).
- Dependence: Economy relies on others’ jobs, not local industries.
- Inequality: Wealth concentrates in urban areas (Kathmandu, Pokhara).
5. Policies for Sustainable Growth and Development
How can Nepal improve? Focus on:
A. Investment in Human Capital
| Policy | How It Helps | Nepal’s Efforts |
|---|---|---|
| Universal Education | Skilled workforce → higher productivity | Free education up to grade 12, but quality is poor |
| Healthcare Access | Healthier workers = more productive | Community health posts, but rural shortages |
| Vocational Training | Teaches skills for jobs (e.g., plumbing, IT) | Limited; most training is theoretical |
B. Industrialization and Diversification
- Problem: Nepal imports even simple goods (e.g., cement, textiles).
- Solutions:
- SEZs (Special Economic Zones): Tax breaks for factories (e.g., Bhairahawa SEZ).
- Tourism: Promote eco-tourism (e.g., Annapurna, Chitwan) to create jobs.
- Renewable Energy: Nepal has huge hydro potential (untapped).
C. Reducing Inequality
- Land Reform: Break up large farms to help smallholders.
- Women’s Empowerment: Reserve seats in local government (Nepal’s constitution does this).
- Progressive Taxation: Tax the rich more to fund social programs.
6. Global Context: Foreign Aid and Trade
Nepal relies on:
- Foreign Aid: ~30% of budget (from India, USA, World Bank).
- Pros: Funds infrastructure (roads, hospitals).
- Cons: Creates dependency; aid may have strings attached (e.g., India’s influence).
- Trade Policies:
- Dependence on India: 60% of trade passes through India → vulnerable to tariffs.
- China’s Belt and Road: Investing in roads/ports (e.g., Kerung-Kathmandu rail), but risks debt traps.
SOLVED EXAMPLE 4: Should Nepal Accept More Foreign Aid? Pros:
- Funds schools/hospitals (e.g., USAID’s health programs).
- Helps after disasters (e.g., 2015 earthquake).
Cons:
- Debt risk: China’s loans may require repayment Nepal can’t afford.
- Political pressure: Aid may come with conditions (e.g., India’s influence).
Answer: Nepal should diversify aid sources (not just India/China) and focus on self-sufficiency (e.g., hydroelectric exports).
Exam Tip: How to Score Full Marks in NEB Exams
NEB exams test concepts + Nepal’s context. Follow this structure:
1. Short Answer Questions (2–5 marks)
Do:
- Define key terms (e.g., "HDI is a measure of development combining life expectancy, education, and income").
- Use one example (e.g., "Nepal’s HDI is 0.594 due to low education").
- Compare growth vs. development (use GDP vs. HDI).
Avoid:
- Just listing stages (e.g., Rostow’s 5 stages without Nepal’s example).
Sample Question: "Differentiate between economic growth and economic development with examples from Nepal." Answer:
| Aspect | Economic Growth | Economic Development |
|---|---|---|
| Focus | Increase in GDP | Improvement in quality of life |
| Measure | GDP per capita ($1,200 in Nepal) | HDI (0.594 in Nepal) |
| Example | Nepal’s GDP grew by 5% in 2023 | Life expectancy rose from 60 to 70 years |
| Limitation | Can happen without reducing poverty | Hard to measure (subjective indicators) |
2. Long Answer Questions (10–15 marks)
Structure:
- Introduction: Define growth/development + Nepal’s context.
- Body:
- Explain 2 theories (e.g., Harrod-Domar + Rostow).
- Discuss 2 challenges (e.g., agriculture dependence, brain drain).
- Suggest 2 policies (e.g., education, SEZs).
- Conclusion: Link to Nepal’s future (e.g., "To develop, Nepal must invest in human capital and diversify its economy").
Sample Question: "Explain the Harrod-Domar model of economic growth. How can Nepal apply this model to achieve sustainable development?" Answer:
Introduction: The Harrod-Domar model shows that growth depends on savings and investment. Nepal’s growth is slow because it saves only 15% of GDP and needs $5 to produce $1 of output.
Model Explanation:
- Formula: Growth Rate = Savings Ratio / Capital-Output Ratio.
- Example: If Nepal saves 20% and needs $4 per $1 output, growth = 5% per year.
Nepal’s Application:
- Increase savings: Encourage bank deposits, reduce tax evasion.
- Reduce capital costs: Cheaper loans for farmers (e.g., Kisan Credit Fund).
- Limitations: Ignores tech/education → Nepal needs complementary policies (e.g., vocational training).
Conclusion: While Harrod-Domar helps, Nepal must also improve education and healthcare to achieve true development, not just GDP growth.
3. Data Interpretation Questions
Do:
- Read the table/graph carefully.
- Link data to Nepal’s situation (e.g., "Nepal’s HDI is lower than Bhutan’s due to...").
- Use comparisons (e.g., "India’s growth is faster than Nepal’s because...").
Sample Question: (Graph shows Nepal’s GDP growth vs. HDI from 1990–2020.) Question: "Analyze the relationship between Nepal’s economic growth and development over 30 years." Answer:
- Growth: GDP grew from $2B (1990) to $35B (2023) → 7% average growth.
- Development: HDI rose from 0.35 to 0.594 → slow progress.
- Gap: Growth outpaced development → inequality likely increased (rich got richer).
- Policy Lesson: Need pro-poor growth (e.g., subsidies for poor farmers).
4. Common Mistakes to Avoid
- Vague answers: Don’t write "Nepal needs development." Say how (e.g., "by improving education").
- Ignoring Nepal: Always relate theories to Nepal (e.g., "Rostow’s Stage 2 fits Nepal because...").
- Memorizing: Exams test application, not rote learning.
Final Checklist for Full Marks
✅ Define key terms (growth vs. development, HDI, etc.). ✅ Use Nepal examples (GDP, HDI, agriculture, remittances). ✅ Compare theories (e.g., Harrod-Domar vs. Rostow). ✅ Suggest policies (education, SEZs, trade diversification). ✅ Link to real-world issues (brain drain, trade deficit).
Good luck! Practice with past NEB papers (available on NEB’s website). Focus on applying concepts to Nepal—that’s where marks are!
Based on the NEB +2 Humanities syllabus for Economics (Eco), unit 10.
Discussion
Loading…