EconomicsUnit 110 min read
Utility, Indifference Curves & Consumer Choice
Unit 1 of Economics explains how consumers make choices based on satisfaction (utility), how indifference curves show trade-offs between goods, and how budget constraints shape decisions—key concepts for NEB exams with solved examples and past-paper questions.
TAKEAWAYS:
- Utility measures satisfaction from goods/services, and marginal utility shows how extra units change total satisfaction.
- Indifference curves map combinations of two goods that give equal satisfaction, sloping downward and convex to the origin.
- Budget line shows affordable combinations given income and prices, and consumer equilibrium occurs where the budget line is tangent to an indifference curve.
- Diminishing marginal utility explains why consumers buy less of a good as they consume more.
- Substitution effect and income effect explain how price changes affect demand.
- NEB exam focus: Graphical analysis, numerical problems, and interpreting indifference curves are common question types.
1. What is Utility?
Utility is the satisfaction or happiness a consumer gets from consuming goods/services. It is not measurable in absolute numbers (like centimeters), but we can compare changes in satisfaction.
Types of Utility
| Type | Definition | Example |
|---|---|---|
| Total Utility | Total satisfaction from consuming all units of a good. | Eating 3 apples gives 30 utils. |
| Marginal Utility | Extra satisfaction from one additional unit of a good. | 4th apple adds 10 utils. |
| Average Utility | Total utility divided by number of units consumed. | 30 utils / 3 apples = 10 utils/apple. |
Law of Diminishing Marginal Utility
As a consumer buys more units of a good, the extra satisfaction (marginal utility) decreases, but it can never become negative.
Why?
- First glass of water → High satisfaction.
- Second glass → Less satisfaction (still positive).
- Tenth glass → May cause discomfort (negative utility).
2. Marginal Utility and Consumer Behavior
Consumers buy goods until marginal utility = price (if free, they buy until marginal utility = 0).
Example: Buying Apples
Suppose:
- Price of 1 apple = Rs. 5
- Marginal utility (MU) of apples:
- 1st apple = 20 utils
- 2nd apple = 15 utils
- 3rd apple = 10 utils
- 4th apple = 5 utils
How many apples should the consumer buy?
- 1st apple: MU (20) > Price (5) → Buy.
- 2nd apple: MU (15) > Price (5) → Buy.
- 3rd apple: MU (10) > Price (5) → Buy.
- 4th apple: MU (5) = Price (5) → Consumer equilibrium (no reason to buy more).
Total utility at equilibrium = 20 + 15 + 10 = 45 utils.
3. Indifference Curves: Showing Consumer Preferences
An indifference curve shows all combinations of two goods that give the same satisfaction.
Key Properties of Indifference Curves
- Downward sloping → More of one good means less of the other (trade-off).
- Convex to the origin → Shows diminishing marginal rate of substitution (MRS).
- Higher curves = higher satisfaction → Further from origin = more goods = more utility.
- Never intersect → Each combination has a unique satisfaction level.
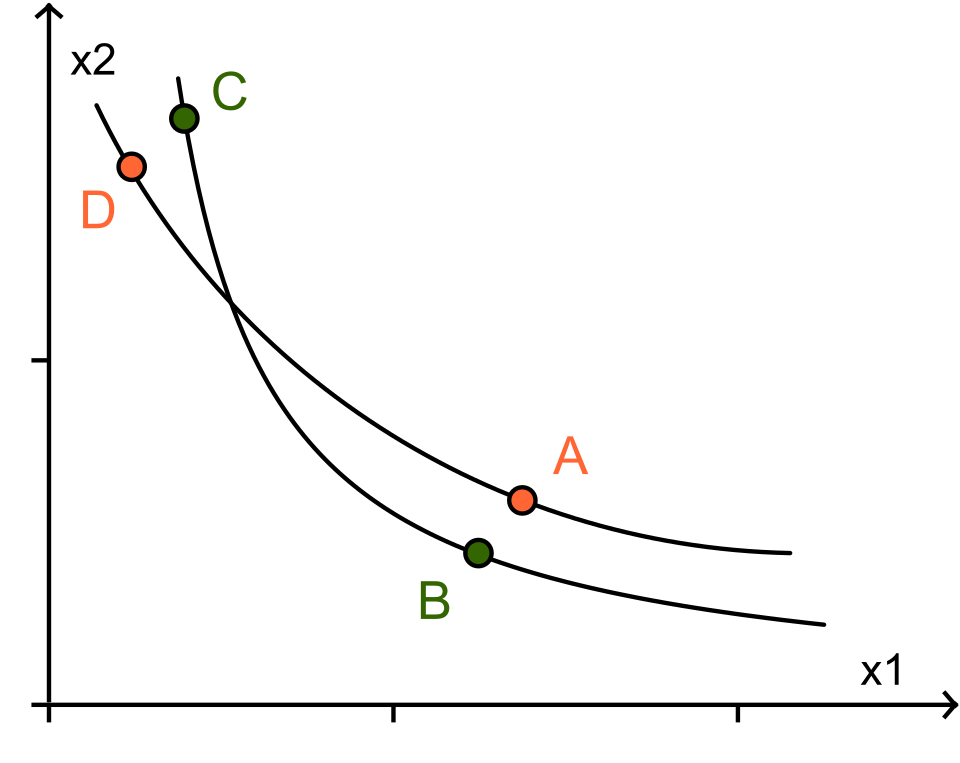 Two indifference curves (IC1 and IC2) with IC2 above IC1, showing higher satisfaction. (Image: Pill, CC0, via Wikimedia Commons)
Marginal Rate of Substitution (MRS)
MRS = How much of Good Y a consumer is willing to give up for one extra unit of Good X, keeping utility constant.
Example: If a consumer is willing to give up 2 bananas for 1 apple, then MRS = 2 bananas/apple.
As consumption moves down-right along the curve, MRS decreases (diminishing MRS).
4. Budget Line and Consumer Choice
A budget line shows all combinations of two goods a consumer can buy with a fixed income and given prices.
Equation of Budget Line
If:
- Income (M) = Rs. 100
- Price of Good X (Px) = Rs. 10
- Price of Good Y (Py) = Rs. 20
Then: (Or: )
Slope of Budget Line = -Px/Py = -10/20 = -0.5 → For every 1 unit of X given up, the consumer can buy 0.5 units of Y.
Consumer Equilibrium
Occurs where:
- Budget line is tangent to the highest possible indifference curve (maximum satisfaction).
- Slope of indifference curve (MRS) = Slope of budget line (Px/Py).
Example: Suppose at equilibrium:
- MRS = 2 (willing to give up 2 bananas for 1 apple).
- Px/Py = 10/20 = 0.5.
But MRS ≠ Px/Py → Not equilibrium! Correction: The consumer adjusts consumption until MRS = Px/Py.
5. Shifts in Budget Line and Indifference Curves
Changes in income or prices shift the budget line, leading to new equilibriums.
| Change | Effect on Budget Line | Effect on Consumer Choice |
|---|---|---|
| Income increases | Shifts right (outward) | Moves to a higher indifference curve. |
| Price of X falls | Rotates outward on X-axis | More of X is bought. |
| Price of Y rises | Rotates inward on Y-axis | Less of Y is bought. |
6. Substitution and Income Effects
When the price of a good changes, two effects occur:
Substitution Effect
- Cheaper good becomes relatively more attractive → Consumer buys more of it.
- Example: If price of tea falls, consumer switches from coffee to tea.
Income Effect
- If price falls, real income increases → Consumer can buy more of both goods.
- Example: Cheaper tea means more purchasing power → May buy more tea and coffee.
Giffen Goods (Exception!)
- Inferior goods where demand increases when price rises (e.g., cheap staple foods).
- Example: If price of rice rises, poor consumers buy less wheat (normal good) and more rice (Giffen good).
Exam Tip: How to Score Full Marks in NEB Questions
Draw diagrams accurately
- Label axes, indifference curves (IC), budget lines (BL), and equilibrium points (E).
- Show shifts clearly with arrows.
Explain steps logically
- Start with given data → Derive budget line → Find equilibrium → Interpret changes.
Common NEB Question Types
- Numerical problems (e.g., "If MU of X = 10 and price = Rs. 2, how many units?").
- Graphical analysis (e.g., "Draw a budget line and show effect of income rise").
- Theoretical questions (e.g., "Explain diminishing MRS").
Avoid common mistakes
- ❌ Forgetting to show convexity in indifference curves.
- ❌ Mislabeling axes (e.g., putting "Quantity" on Y-axis).
- ❌ Ignoring real-world assumptions (e.g., no negative utility).
Solved NEB-Style Questions
Question 1: Marginal Utility Problem
If the marginal utility of a good is 20, 18, 16, 14, 12, and its price is Rs. 4, how many units will a rational consumer buy?
Solution: Compare MU and Price:
- 1st unit: MU (20) > Price (4) → Buy.
- 2nd unit: MU (18) > Price (4) → Buy.
- 3rd unit: MU (16) > Price (4) → Buy.
- 4th unit: MU (14) > Price (4) → Buy.
- 5th unit: MU (12) > Price (4) → Buy.
Answer: 5 units (since MU > Price for all 5 units).
Question 2: Indifference Curve Analysis
Draw an indifference curve for two goods (X and Y) and show the effect of:
- Increase in income.
- Fall in price of X.
Solution:
- Income Increase → Budget line shifts right (outward) → New equilibrium on a higher indifference curve.
- Price of X Falls → Budget line rotates outward on X-axis → More X is bought.
Question 3: Consumer Equilibrium
Given:
- MU of Good A = 10, Price = Rs. 2
- MU of Good B = 8, Price = Rs. 4 Is the consumer in equilibrium? If not, what should they do?
Solution:
- MRS = MU of A / MU of B = 10/8 = 1.25
- Price ratio (Px/Py) = 2/4 = 0.5
- Since MRS (1.25) ≠ Px/Py (0.5), the consumer is not in equilibrium.
- Action: Buy more of Good A (cheaper relative to B) until MRS = Px/Py.
NEB Past-Paper Questions (Practice)
- "Explain the law of diminishing marginal utility with an example." (5 marks)
- "Draw a budget line and show the consumer equilibrium. What happens if the price of Good Y rises?" (7 marks)
- "Differentiate between substitution effect and income effect with diagrams." (6 marks)
- "If the marginal utility of a good is 15, 12, 9, 6, and its price is Rs. 3, how many units will be bought?" (4 marks)
Summary Table: Key Concepts
| Concept | Definition | Graphical Representation |
|---|---|---|
| Utility | Satisfaction from goods. | Not directly graphed. |
| Marginal Utility | Extra satisfaction per extra unit. | Downward-sloping curve. |
| Indifference Curve | Same satisfaction, different combinations. | Downward-sloping, convex curve. |
| Budget Line | Affordable combinations given income. | Straight line with intercepts. |
| Consumer Equilibrium | MRS = Px/Py, highest IC possible. | Tangency point between IC and BL. |
Final Advice for NEB Exam
✅ Memorize properties of indifference curves (downward-sloping, convex, non-intersecting). ✅ Practice numerical problems on marginal utility and consumer equilibrium. ✅ Draw diagrams neatly—examiners check for accuracy! ✅ Understand real-world applications (e.g., why people buy less of a good as they consume more).
Good luck! 🚀 You’ve got this!
Based on the NEB +2 Humanities syllabus for Economics (Eco), unit 1.
Discussion
Loading…