EconomicsUnit 109 min read
Macroeconomics: Scope, Goals & Key Sectors
Unit 10 of Economics introduces macroeconomics, explaining its scope, goals, and the three key sectors (households, businesses, government) that drive a nation’s economy. Learn how GDP is measured, why full employment matters, and how price stability is maintained.
TAKEAWAYS:
- Macroeconomics studies national economies (GDP, inflation, unemployment) while microeconomics focuses on individual choices.
- The three economic sectors (households, firms, government) interact to determine a country’s economic health.
- GDP measures total output, but GNP tracks income earned by a nation’s citizens worldwide.
- Full employment (4–6% unemployment) and price stability (low inflation) are key macroeconomic goals.
- Fiscal policy (taxes/spending) and monetary policy (money supply) are tools governments use to stabilize economies.
- Nepal’s macroeconomic challenges include high unemployment and inflation, requiring balanced policies.
What is Macroeconomics?
Macroeconomics is the study of a nation’s entire economy. Unlike microeconomics (which looks at individual buyers/sellers), macroeconomics focuses on big-picture issues like:
- Growth (how fast the economy expands).
- Unemployment (how many people lack jobs).
- Inflation (rising prices over time).
- Government policies (taxes, spending, money supply).
Why Study Macroeconomics?
- Helps governments plan budgets and control inflation.
- Explains why some countries grow faster than others.
- Shows how global events (like pandemics or wars) affect local economies.
Key Goals of Macroeconomics
Macroeconomics aims to achieve four main goals for a stable economy:
| Goal | What It Means | Ideal Target |
|---|---|---|
| Economic Growth | Increase in total output (GDP) over time. | 5–7% annual growth. |
| Full Employment | Most people who want jobs have them. | 4–6% unemployment rate. |
| Price Stability | Low and steady inflation. | 4–6% annual inflation. |
| Equitable Distribution | Fair income distribution. | Reduced poverty, wealth gaps. |
Why These Goals Matter:
- Growth → More jobs, better living standards.
- Full Employment → Less crime, higher productivity.
- Price Stability → Savings retain value; businesses plan easily.
- Equity → Social harmony, reduced protests.
The Three Economic Sectors
Every economy has three main players:
Households
- Role: Consumers (buy goods/services) and workers (supply labor).
- Example: You spend money on books (consumption) and work for wages.
Firms (Businesses)
- Role: Produce goods/services, hire workers, pay taxes.
- Example: A factory makes shoes, employs workers, and sells to shops.
Government
- Role: Provides public goods (roads, schools), collects taxes, and regulates markets.
- Example: Nepal’s government builds highways and taxes businesses to fund them.
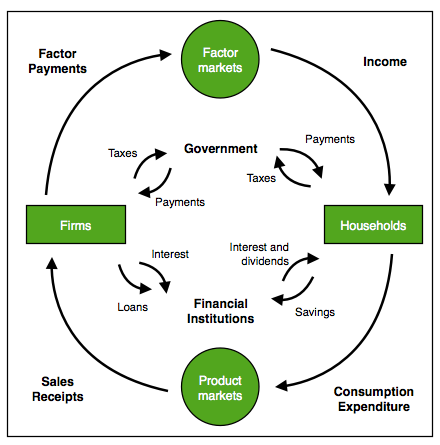 A labeled diagram showing money flowing between households, firms, and government. (Image: Le0t, CC BY-SA 3.0, via Wikimedia Commons)
Measuring Economic Performance: GDP
GDP (Gross Domestic Product) is the total market value of all final goods and services produced in a country in one year.
How is GDP Calculated?
There are three ways to measure GDP:
| Method | Formula | Example |
|---|---|---|
| Production (Output) | Sum of all goods/services produced. | Cars + Rice + Electricity = Total GDP. |
| Income | Sum of all incomes (wages, profits). | Salaries + Rent + Interest = GDP. |
| Expenditure | Sum of all spending. | C + I + G + (X – M) = GDP. |
Where:
- C = Consumption (households)
- I = Investment (businesses)
- G = Government spending
- X – M = Exports minus Imports
Solved Example: If Nepal’s Consumption (C) = Rs. 500 billion, Investment (I) = Rs. 200 billion, Government Spending (G) = Rs. 150 billion, and Net Exports (X – M) = Rs. 50 billion, then GDP = 500 + 200 + 150 + 50 = Rs. 900 billion.
GDP vs. GNP: What’s the Difference?
| Term | Definition | Example |
|---|---|---|
| GDP | Output within a country’s borders. | A Chinese factory in Nepal counts toward Nepal’s GDP. |
| GNP | Income earned by a country’s citizens, no matter where. | Nepali workers abroad send money home → counts in Nepal’s GNP. |
Why It Matters:
- GDP shows local economic activity.
- GNP shows total income of citizens (useful for comparing living standards).
Macroeconomic Challenges in Nepal
Nepal faces three major macroeconomic issues:
High Unemployment
- Cause: Rapid population growth, lack of job-creating industries.
- Effect: Youth migration, brain drain.
- Solution: Invest in tourism, IT, and agriculture.
Inflation
- Cause: Money supply growing faster than output.
- Effect: Prices rise; poor suffer most.
- Solution: Control money supply, reduce imports.
Low Economic Growth
- Cause: Poor infrastructure, political instability.
- Effect: Slow development, poverty.
- Solution: Foreign investment, better policies.
Fiscal Policy vs. Monetary Policy
Governments use two main tools to stabilize the economy:
| Policy | Who Controls It? | Tools Used | Effect on Economy |
|---|---|---|---|
| Fiscal Policy | Government | Taxes, Government Spending | Increases/decreases demand. |
| Monetary Policy | Central Bank (NRB) | Interest Rates, Money Supply | Controls inflation, employment. |
Example:
- Fiscal Policy: If unemployment is high, the government spends more (e.g., builds roads) to create jobs.
- Monetary Policy: If inflation is rising, the Nepal Rastra Bank (NRB) raises interest rates to reduce borrowing/spending.
Exam Tip: How to Score Full Marks
Define Key Terms Clearly
- Example: "Macroeconomics is the study of aggregate economic variables like GDP, inflation, and unemployment at the national level."
Use Diagrams
- Draw circular flow diagrams or GDP component charts to explain interactions.
Compare GDP and GNP
- Always mention where production happens vs. who earns income.
Relate to Nepal
- Example: "Nepal’s high unemployment is due to agricultural dependency and lack of industrialization."
Practice Numerical Problems
- Solve GDP calculation questions using C + I + G + (X – M).
Explain Policies with Examples
- Example: "If the NRB lowers interest rates, businesses borrow more → investment increases → GDP grows."
NEB Board-Style Questions (Practice)
Short Answer (5 marks each)
- Define macroeconomics. How does it differ from microeconomics? Give one example of each.
- Explain the circular flow of income. Why is the government an important sector in this flow?
- Calculate GDP if:
- Consumption (C) = Rs. 800 billion
- Investment (I) = Rs. 300 billion
- Government Spending (G) = Rs. 200 billion
- Exports (X) = Rs. 150 billion, Imports (M) = Rs. 100 billion
Long Answer (10 marks)
- Discuss the four goals of macroeconomics. Why is achieving all four simultaneously difficult? Explain with reference to Nepal.
- How does fiscal policy help control inflation? What are the limitations of fiscal policy in developing countries like Nepal?
Final Note: Macroeconomics helps us understand why economies grow or shrink. By learning GDP, unemployment, and government policies, you can analyze Nepal’s economic challenges and suggest solutions. Practice diagrams and numerical problems to excel in exams!
Based on the NEB +2 Management syllabus for Economics (Eco), unit 10.
Discussion
Loading…