EconomicsUnit 512 min read
Market Equilibrium: Forces, Graphs & Policy
Unit 5 of Economics explains how supply and demand interact to determine prices and quantities in a market, what happens when markets are not in equilibrium, and how government policies can shift equilibrium positions.
TAKEAWAYS:
- Market equilibrium occurs where quantity demanded equals quantity supplied, creating a stable price and quantity.
- Graphically, equilibrium is the intersection point of the demand and supply curves.
- Changes in demand or supply shift curves and create new equilibria.
- Government policies like taxes and subsidies can affect market equilibrium.
- Shortages and surpluses occur when markets are not in equilibrium.
- Understanding equilibrium helps explain real-world price changes and market outcomes.
What is Market Equilibrium?
Market equilibrium is a situation where the quantity of a good or service that buyers want to buy (demand) is exactly equal to the quantity that sellers want to sell (supply). At this point, the market is said to be in balance, and there is no tendency for prices to change.
Key Characteristics of Market Equilibrium
- Stable Price: The price remains constant because there is no pressure from buyers or sellers to change it.
- No Shortages or Surpluses: There is no excess demand (shortage) or excess supply (surplus).
- Consumer and Producer Satisfaction: Both buyers and sellers are satisfied with the price and quantity exchanged.
Visualizing Equilibrium
How Equilibrium Works: The Interaction of Demand and Supply
Demand and Supply Curves
- Demand Curve: Shows the relationship between the price of a good and the quantity demanded. It slopes downward because as price falls, more people are willing to buy the good.
- Supply Curve: Shows the relationship between the price of a good and the quantity supplied. It slopes upward because as price rises, producers are willing to supply more.
Finding Equilibrium Graphically
At the equilibrium point:
- The quantity demanded by consumers equals the quantity supplied by producers.
- There is no pressure for the price to rise or fall.
Example: Market for Apples
Suppose the demand and supply for apples in a market are given by:
- Demand Equation:
- Supply Equation:
To find equilibrium:
- Set :
- Solve for :
- Substitute back into either equation to find : So, the equilibrium price is Rs. 13.33, and the equilibrium quantity is 73.34 units.
What Happens When the Market is Not in Equilibrium?
Shortages
A shortage occurs when the quantity demanded exceeds the quantity supplied at a given price. This happens when the price is set below the equilibrium price.
Example: Shortage in the Wheat Market
- Cause: Price is too low (e.g., government price control).
- Effect:
- Buyers compete for limited supply, leading to black markets or long queues.
- Sellers may raise prices illegally.
- Example: In Nepal, during the COVID-19 pandemic, the demand for masks increased, but supply was limited, leading to shortages and higher black-market prices.
Surpluses
A surplus occurs when the quantity supplied exceeds the quantity demanded at a given price. This happens when the price is set above the equilibrium price.
Example: Surplus in the Rice Market
- Cause: Price is too high (e.g., lack of demand).
- Effect:
- Unsold goods pile up, leading to storage costs for producers.
- Producers may lower prices to sell excess stock.
- Example: In Nepal, during the monsoon season, the supply of certain vegetables increases due to harvest, but demand may not keep up, leading to surpluses and lower prices.
How Government Policies Affect Equilibrium
Governments often intervene in markets to achieve social or economic goals. These interventions can shift the demand or supply curves, changing the equilibrium price and quantity.
1. Price Ceiling (Maximum Price)
A price ceiling is a government-imposed maximum price that sellers can charge for a good or service.
Example: Rent Control in Kathmandu
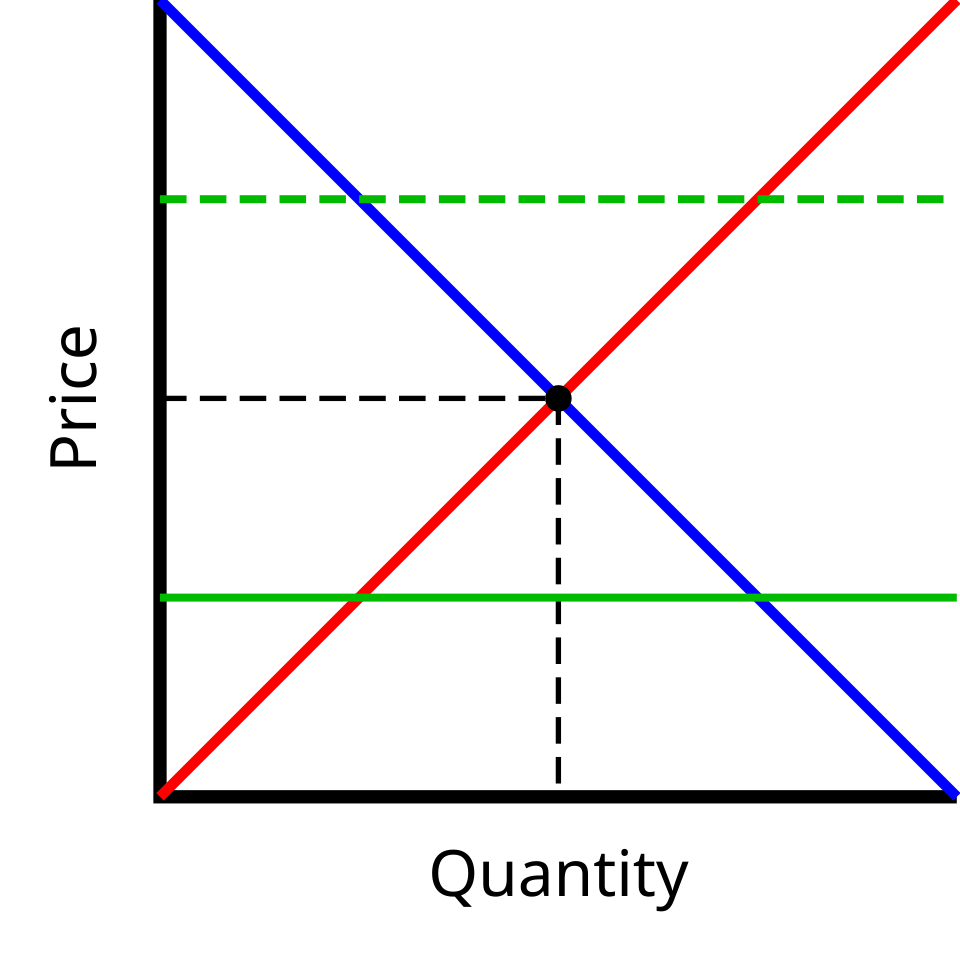 A supply and demand graph with a price ceiling below equilibrium. (Image: en:User:Wdflake, Public domain, via Wikimedia Commons)
- Effect:
- If set below equilibrium, it creates a shortage.
- Landlords may reduce maintenance or rent out fewer apartments.
- Example: In Kathmandu, rent control laws have led to a shortage of rental housing.
2. Price Floor (Minimum Price)
A price floor is a government-imposed minimum price that buyers must pay for a good or service.
Example: Minimum Wage in Nepal
- Effect:
- If set above equilibrium, it creates a surplus (e.g., unemployment).
- Example: Nepal’s minimum wage laws aim to protect workers but may lead to higher unemployment if set too high.
3. Taxes and Subsidies
- Taxes: Increase the cost of production, shifting the supply curve leftward, raising equilibrium price and reducing equilibrium quantity.
- Example: A tax on cigarettes increases their price, reducing smoking.
- Subsidies: Reduce the cost of production, shifting the supply curve rightward, lowering equilibrium price and increasing equilibrium quantity.
- Example: Subsidies on agricultural products in Nepal help farmers sell more.
Real-World Applications of Market Equilibrium
1. Agricultural Markets in Nepal
- Problem: Farmers often face price fluctuations due to seasonal changes in supply.
- Solution: Government can set minimum support prices to ensure farmers get fair prices.
- Example: The government buys rice from farmers at a fixed price during harvest to stabilize prices.
2. Fuel Prices in Nepal
- Problem: Fuel prices are often controlled by the government, leading to shortages.
- Solution: Allowing market forces to determine prices can lead to better allocation of resources.
- Example: During fuel shortages in 2021, long queues and black markets emerged due to price controls.
3. Labor Markets
- Problem: Unemployment can occur if the minimum wage is set too high.
- Solution: Equilibrium wage rates help balance supply and demand for labor.
- Example: In Nepal, the equilibrium wage for unskilled labor is often determined by market forces rather than government rules.
Common Mistakes to Avoid
- Confusing Shortages and Surpluses:
- Shortage = Demand > Supply (price too low).
- Surplus = Supply > Demand (price too high).
- Ignoring Shifts vs. Movements:
- A shift in the curve is caused by non-price factors (e.g., income, technology).
- A movement along the curve is caused by price changes.
- Assuming Government Policies Always Help:
- Price ceilings and floors can create unintended consequences like shortages or surpluses.
Exam Tip: How to Score Full Marks in NEB Exams
1. Understand the Graphs
- Always draw supply and demand curves to explain equilibrium.
- Label equilibrium price () and quantity () clearly.
- Show shifts (left/right) and movements (up/down) correctly.
2. Explain Real-World Examples
- NEB often asks for Nepali examples (e.g., fuel, agriculture, labor).
- Relate theory to current events (e.g., COVID-19 shortages, post-earthquake reconstruction).
3. Compare Policies
- Use tables to compare effects of taxes, subsidies, price ceilings, and floors.
- Example:
Policy Effect on Price Effect on Quantity Example in Nepal Price Ceiling Decreases Decreases Rent control in Kathmandu Price Floor Increases Decreases Minimum wage laws Tax Increases Decreases Cigarette taxes Subsidy Decreases Increases Agricultural subsidies
4. Use Equations When Needed
- For numerical questions, always show steps to solve for equilibrium.
- Example:
- Given: , .
- Find equilibrium: Then, .
5. Practice NEB-Style Questions
Question 1: Short Answer
"Explain the concept of market equilibrium with the help of a diagram."
Answer: Market equilibrium is a state where quantity demanded equals quantity supplied, resulting in a stable price and quantity. The diagram below shows equilibrium at point E, where the demand (D) and supply (S) curves intersect. At this point, the equilibrium price is , and the equilibrium quantity is .
Question 2: Numerical
"The demand and supply functions for a good are given by: Find the equilibrium price and quantity. What happens if the government imposes a price ceiling of Rs. 15?"
Answer:
Equilibrium: So, equilibrium price = Rs. 13.33, quantity = 46.67 units.
Price Ceiling at Rs. 15:
- At :
- Since , there is a surplus of 10 units.
- However, if the ceiling is below equilibrium (e.g., Rs. 10), there would be a shortage.
Question 3: Essay
"Discuss the role of government intervention in correcting market failures. Give examples from the Nepalese economy."
Answer: Government intervention is necessary to correct market failures (e.g., monopolies, externalities, public goods). In Nepal:
Price Controls:
- Example: Fuel price controls during shortages lead to black markets and inefficiencies.
- Solution: Allow market forces to determine prices, but regulate essential goods.
Subsidies:
- Example: Agricultural subsidies help farmers sell more, ensuring food security.
- Effect: Lowers prices for consumers, increases supply.
Taxes:
- Example: Taxes on tobacco reduce smoking, improving public health.
- Effect: Higher prices discourage consumption.
Minimum Wage Laws:
- Example: Nepal’s minimum wage aims to protect workers but may cause unemployment if set too high.
- Solution: Balance between fairness and market realities.
Conclusion: Government intervention should aim to correct inefficiencies while minimizing unintended consequences like shortages or surpluses.
Final Tip: Always relate theory to Nepal in your answers. NEB examiners love real-world applications!
Based on the NEB +2 Management syllabus for Economics (Eco), unit 5.
Discussion
Loading…