AccountancyUnit 1114 min read
Cost Accounting: Concepts, Classifications, Cost Sheet & Analysis
Unit 11 of Accountancy explains cost accounting basics—how to classify costs, prepare cost sheets, and analyze expenses for decision-making. Learn definitions, cost behaviors, overhead allocation, and how cost sheets differ from financial statements.
TAKEAWAYS:
- Cost accounting tracks production costs (not just profits) to help managers make better decisions.
- Costs are classified by element (material, labor, overhead) and behavior (fixed, variable, semi-variable).
- A cost sheet summarizes all costs for a product/service and calculates total cost per unit.
- Overhead allocation ensures indirect costs are fairly distributed using methods like direct labor hours or machine hours.
- Cost accounting helps businesses control costs, set prices, and improve efficiency.
- Unlike financial accounting, cost accounting focuses on internal reporting for management.
What is Cost Accounting?
Cost accounting is a branch of accounting that measures, records, and analyzes production costs to help managers make informed decisions. Unlike financial accounting (which reports profits for external users), cost accounting focuses on internal reporting to improve efficiency and profitability.
Key Differences: Cost vs. Financial Accounting
| Feature | Cost Accounting | Financial Accounting |
|---|---|---|
| Purpose | Helps managers control costs | Reports profits for shareholders/tax |
| Users | Internal (managers, production heads) | External (investors, banks, government) |
| Time Period | Short-term (daily/weekly/monthly) | Long-term (annual/quarterly) |
| Focus | Cost of production | Profitability and financial health |
| Rules | Flexible (GAAP not strictly followed) | Strict (GAAP/IFRS must be followed) |
| Example Reports | Cost sheets, budget reports | Income statement, balance sheet |
Why is cost accounting important?
- Helps set selling prices.
- Identifies wastage in production.
- Assists in budgeting and cost control.
- Supports decision-making (e.g., make vs. buy, product mix).
Classification of Costs
Costs are grouped in different ways to analyze and control expenses effectively.
1. By Element (What is being spent?)
Costs are divided into three main categories:
- Direct Material (DM): Raw materials directly used in production (e.g., wood for furniture, fabric for clothes).
- Direct Labor (DL): Wages of workers who directly work on production (e.g., carpenters, tailors).
- Manufacturing Overhead (MOH): Indirect costs like rent, electricity, depreciation of machinery, and supervisors' salaries.
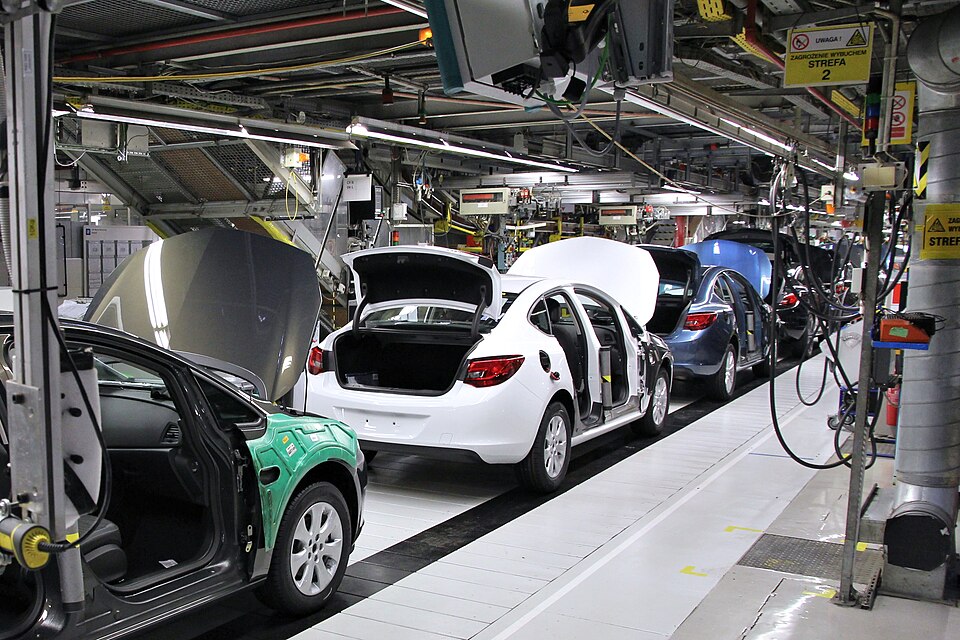 Direct labor (workers assembling), direct materials (components), and overhead (machinery, factory rent). (Image: Marek Ślusarczyk (Tupungato) Photo portfolio, CC BY 3.0, via Wikimedia Commons)
2. By Behavior (How does cost change with production?)
Costs behave differently as production levels change. This is crucial for cost-volume-profit (CVP) analysis.
- Fixed Cost (FC): Remains constant regardless of production (e.g., rent, salaries, insurance).
- Example: A factory pays ₹50,000/month for rent, even if it produces 0 or 10,000 units.
- Variable Cost (VC): Changes directly with production (e.g., raw materials, piece-rate wages).
- Example: If producing 1 unit costs ₹100 in materials, 100 units cost ₹10,000.
- Semi-Variable Cost: Has both fixed and variable parts (e.g., electricity bill with a fixed charge + usage fee).
- Example: ₹2,000 fixed + ₹5 per unit produced.
Worked Example: Cost Behavior A company has:
- Fixed cost = ₹20,000
- Variable cost per unit = ₹5
- Produces 1,000 units.
Calculate total cost at 1,000 and 2,000 units. Solution:
- At 1,000 units: Total Cost = FC + (VC × Units) = ₹20,000 + (₹5 × 1,000) = ₹25,000
- At 2,000 units: Total Cost = ₹20,000 + (₹5 × 2,000) = ₹30,000
3. By Function (Where does the cost occur?)
Costs are also classified based on the department or function they belong to:
- Production Costs: Costs incurred to manufacture a product (DM + DL + MOH).
- Non-Production Costs: Costs not related to production (e.g., selling, administrative, research expenses).
4. By Controllability (Who can control the cost?)
- Controllable Cost: Can be influenced by a manager (e.g., raw material purchases, overtime wages).
- Uncontrollable Cost: Cannot be easily changed (e.g., depreciation, taxes).
Cost Sheet: The Heart of Cost Accounting
A cost sheet is a summary statement that shows:
- Total cost of production for a period.
- Cost per unit of the product.
- Profitability of the product.
Components of a Cost Sheet
flowchart TD
A["Cost Sheet"] --> B["Direct Material"]
A --> C["Direct Labor"]
A --> D["Manufacturing Overhead"]
A --> E["Total Production Cost"]
E --> F["Add: Office & Selling Expenses"]
F --> G["Total Cost"]
G --> H["Less: Sales"]
H --> I["Profit/Loss"]
Format of a Cost Sheet:
| Particulars | Amount (₹) |
|---|---|
| Direct Material | |
| Opening Stock | 5,000 |
| Purchases | 50,000 |
| Less: Closing Stock | (8,000) |
| Direct Material Used | 47,000 |
| Direct Labor | 30,000 |
| Manufacturing Overhead | 20,000 |
| Total Production Cost | 97,000 |
| Add: Office & Selling Expenses | 15,000 |
| Total Cost | 112,000 |
| Less: Sales | (100,000) |
| Profit/Loss | 12,000 |
Worked Example: Preparing a Cost Sheet
Given:
- Opening stock of raw material: ₹5,000
- Purchases: ₹50,000
- Closing stock of raw material: ₹8,000
- Direct labor: ₹30,000
- Manufacturing overhead: ₹20,000
- Office and selling expenses: ₹15,000
- Sales: ₹100,000
- Number of units produced: 1,000
Solution:
- Calculate Direct Material Used:
- Opening Stock + Purchases – Closing Stock = ₹5,000 + ₹50,000 – ₹8,000 = ₹47,000
- Total Production Cost:
- DM + DL + MOH = ₹47,000 + ₹30,000 + ₹20,000 = ₹97,000
- Total Cost:
- Production Cost + Office & Selling Expenses = ₹97,000 + ₹15,000 = ₹112,000
- Cost per Unit:
- Total Cost ÷ Number of Units = ₹112,000 ÷ 1,000 = ₹112 per unit
- Profit/Loss:
- Sales – Total Cost = ₹100,000 – ₹112,000 = (₹12,000) Loss
Cost Sheet:
| Particulars | Amount (₹) |
|---|---|
| Direct Material Used | 47,000 |
| Direct Labor | 30,000 |
| Manufacturing Overhead | 20,000 |
| Total Production Cost | 97,000 |
| Office & Selling Expenses | 15,000 |
| Total Cost | 112,000 |
| Sales | (100,000) |
| Loss | (12,000) |
Allocation and Apportionment of Overheads
Manufacturing Overhead (MOH) includes indirect costs like rent, depreciation, and supervisors' salaries. These must be allocated (assigned to specific departments) and apportioned (distributed to products) fairly.
Methods of Overhead Apportionment
- Direct Labor Hours Method:
- Overhead is distributed based on labor hours used by each product.
- Example: If Product A uses 500 hours and Product B uses 300 hours out of total 800 hours, Product A gets 62.5% of overhead.
Machine Hours Method:
- Overhead is distributed based on machine time used.
- Example: If a machine runs 1,000 hours for Product X and 500 hours for Product Y, Product X gets 66.67% of overhead.
Unit Cost Method:
- Overhead is distributed per unit produced.
- Example: If total overhead is ₹20,000 and 1,000 units are produced, each unit bears ₹20 of overhead.
Worked Example: Overhead Apportionment A factory has:
- Total overhead = ₹60,000
- Product A: 500 labor hours
- Product B: 300 labor hours
- Total labor hours = 800
Solution (Using Labor Hours Method):
- Overhead rate = Total Overhead ÷ Total Labor Hours = ₹60,000 ÷ 800 = ₹75 per hour
- Overhead for Product A = 500 × ₹75 = ₹37,500
- Overhead for Product B = 300 × ₹75 = ₹22,500
Cost Volume Profit (CVP) Analysis
CVP analysis helps determine how changes in costs and volume affect profits. Key terms:
- Break-even point (BEP): The point where Total Revenue = Total Cost (no profit, no loss).
- Margin of Safety (MOS): The difference between actual sales and break-even sales.
Formula for Break-Even Point (in units):
Worked Example: Break-Even Analysis A company sells a product at ₹50 per unit. Variable cost per unit is ₹30, and fixed costs are ₹20,000.
Solution:
- Contribution per unit = Selling Price – Variable Cost = ₹50 – ₹30 = ₹20
- BEP (units) = Fixed Cost ÷ Contribution per unit = ₹20,000 ÷ ₹20 = 1,000 units
- BEP (₹) = 1,000 × ₹50 = ₹50,000
Interpretation:
- The company must sell 1,000 units (₹50,000) to cover all costs.
- If it sells 1,500 units, profit = (1,500 – 1,000) × ₹20 = ₹10,000.
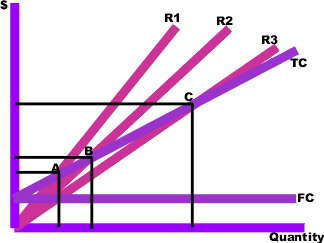 Graph showing fixed costs, total costs, total revenue, and the break-even point. (Image: Mydogategodshat at English Wikipedia, Public domain, via Wikimedia Commons)
Marginal Costing vs. Absorption Costing
Two methods of costing affect how fixed overheads are treated.
| Feature | Marginal Costing | Absorption Costing |
|---|---|---|
| Treatment of Fixed Overhead | Treated as a period cost (expensed immediately) | Capitalized (added to inventory) |
| Inventory Valuation | Only variable costs included | All production costs included |
| Profit Impact | Profit fluctuates with production levels | Profit stable (even if sales are low) |
| Use | Short-term decisions (e.g., pricing) | Legal requirements (GAAP/IFRS) |
| Example | Used in CVP analysis | Used in financial statements |
Worked Example: Marginal vs. Absorption Costing A company produces 1,000 units with:
- Variable cost per unit = ₹40
- Fixed overhead = ₹20,000
- Selling price per unit = ₹60
- All units are sold.
Solution:
Marginal Costing:
- Cost per unit = Variable Cost = ₹40
- Total Cost = 1,000 × ₹40 = ₹40,000
- Profit = (₹60 – ₹40) × 1,000 = ₹20,000
- Fixed Overhead is expensed fully (₹20,000) in the period.
Absorption Costing:
- Fixed Overhead per unit = ₹20,000 ÷ 1,000 = ₹20
- Cost per unit = Variable Cost + Fixed Overhead = ₹40 + ₹20 = ₹60
- Total Cost = 1,000 × ₹60 = ₹60,000
- Profit = (₹60 – ₹60) × 1,000 = ₹0
- Fixed Overhead is part of inventory value.
Note: If not all units are sold, absorption costing shows higher profits because unsold inventory carries fixed overhead.
Exam Tip: How to Score Full Marks in NEB Exams
Understand Key Definitions:
- Always define terms like cost sheet, overhead apportionment, break-even point clearly.
- Example: "Cost sheet is a statement that shows the total cost of production and cost per unit."
Show Calculations Step-by-Step:
- NEB exams love numericals. Always write:
- Given data → Formula → Calculation → Final answer.
- Example for cost per unit:
Cost per unit = (Total Cost) / (Number of Units)
              = ₹112,000 / 1,000
              = ₹112
- NEB exams love numericals. Always write:
Draw Diagrams/Charts Where Needed:
- For CVP analysis, always draw a break-even chart.
- For cost classifications, use flowcharts or tables.
Differentiate Between Concepts:
- Marginal vs. Absorption Costing
- Fixed vs. Variable Costs
- Direct vs. Indirect Costs
Practical Examples:
- Relate theory to real-life businesses (e.g., garment factories, food processing).
- Example: "In a biscuit factory, flour is a direct material, while factory rent is an overhead."
Common Mistakes to Avoid:
- Ignoring closing stock in material cost calculation.
- Miscounting labor hours in overhead apportionment.
- Forgetting to add office/selling expenses in the cost sheet.
NEB Board-Style Questions (Practice!)
Short Answer Questions (2 marks each)
- Define cost accounting and state its two objectives.
- What is the difference between direct labor and indirect labor?
- Explain the break-even point with an example.
- Why is overhead apportionment necessary in cost accounting?
Numerical Problems (5-10 marks)
From the following data, prepare a cost sheet:
- Opening stock of raw material: ₹10,000
- Purchases: ₹80,000
- Closing stock of raw material: ₹5,000
- Direct labor: ₹40,000
- Manufacturing overhead: ₹30,000
- Office expenses: ₹15,000
- Number of units produced: 5,000
Calculate the break-even point in units and amount for a company with:
- Selling price per unit: ₹100
- Variable cost per unit: ₹60
- Fixed costs: ₹50,000
Long Answer Questions (10-15 marks)
- Explain the classification of costs by element, behavior, and function. Give examples for each.
- What is marginal costing? How does it differ from absorption costing? Show with an example.
- A factory has the following overheads:
- Rent: ₹20,000
- Depreciation: ₹10,000
- Supervisors' salary: ₹15,000
- Apportion these overheads to two departments (A and B) using the labor hours method:
- Department A: 1,000 hours
- Department B: 500 hours
Final Tip: Practice at least 5 numericals from past NEB papers. Cost accounting is 50% numerical, so master calculations!
Based on the NEB +2 Management syllabus for Accountancy (Acc), unit 11.
Discussion
Loading…