Business MathematicsUnit 911 min read
Probability Distributions: Types, Formulas & Business Uses
Unit 9 of Business Mathematics teaches probability distributions—how to model random events in business, including binomial, Poisson, and normal distributions, with solved examples and NEB-style questions.
TAKEAWAYS:
- Probability distributions show how likely different outcomes are in business decisions (e.g., sales, defects, or profits).
- Binomial is for fixed trials with two outcomes (success/failure), Poisson for rare events over time, and Normal for symmetric data like heights or test scores.
- Formulas like (binomial) or (mean) help calculate probabilities.
- Business uses include risk assessment, quality control, and forecasting (e.g., predicting defective products or customer arrivals).
- Graphs (bar charts for discrete, curves for continuous) visualize distributions—key for interpreting results.
- NEB exams test definitions, formula applications, and real-world scenario problems (e.g., "A factory has 5% defective items; find the probability of 2 defects in 20 items").
What is a Probability Distribution?
A probability distribution is a function that gives the probabilities of all possible outcomes of a random experiment. It answers:
- What outcomes can happen?
- How likely is each outcome?
Types of Distributions
Probability distributions are classified into two main types:
Discrete Distributions
- Outcomes are countable (e.g., number of customers, defective items).
- Examples: Binomial, Poisson.
- Graph: Bar chart (height = probability).
Continuous Distributions
- Outcomes are measurable (e.g., height, weight, time).
- Examples: Normal, Exponential.
- Graph: Smooth curve (area under curve = probability).
1. Binomial Distribution
Definition
- Used when:
- There are fixed trials (e.g., 10 coin tosses).
- Each trial has two outcomes (success/failure, e.g., pass/fail).
- Probability of success () is constant for each trial.
- Trials are independent (one trial doesn’t affect another).
Formula
The probability of getting exactly successes in trials is: Where:
- (combinations).
- = probability of success.
- = probability of failure.
Key Parameters
- Mean ():
- Variance ():
- Standard Deviation ():
Worked Example
Problem: A factory produces light bulbs with a 5% defect rate. If 20 bulbs are tested, what is the probability that exactly 2 are defective? Solution:
- Identify parameters:
- (trials),
- (defective bulbs),
- (probability of defect).
- Use the binomial formula:
- Calculate combinations:
- Calculate probabilities:
- Multiply:
Answer: The probability is 16.08%.
Graph of Binomial Distribution
Applications in Business
- Quality control (e.g., probability of defective products).
- Marketing (e.g., probability of customers buying a product).
- Finance (e.g., probability of loan defaults).
2. Poisson Distribution
Definition
- Used for rare events occurring in a fixed interval (time, distance, area).
- Example: Number of calls to a call center per hour, machine failures per day.
- Assumes events are independent and occur at a constant average rate ().
Formula
The probability of exactly events occurring is: Where:
- = Euler’s number (~2.71828),
- = average number of events per interval.
Key Parameters
- Mean ():
- Variance ():
Worked Example
Problem: A bank receives an average of 3 complaints per day. What is the probability of receiving exactly 5 complaints tomorrow? Solution:
- Identify (average complaints/day).
- Use the Poisson formula for :
- Calculate:
- Multiply:
Answer: The probability is 10.08%.
Graph of Poisson Distribution
Comparison: Binomial vs. Poisson
| Feature | Binomial Distribution | Poisson Distribution |
|---|---|---|
| Use Case | Fixed trials, two outcomes | Rare events over time/space |
| Parameters | (trials), (probability) | (average rate) |
| Formula | ||
| Mean | ||
| Variance | ||
| Example | Defective items in a batch | Calls to a call center per hour |
3. Normal Distribution
Definition
- Continuous distribution shaped like a bell curve.
- Symmetric about the mean ().
- Used for data like heights, test scores, or measurement errors.
- Defined by mean () and standard deviation ().
Formula
The probability density function (PDF) is: For probabilities, we use the standard normal table (Z-table):
Worked Example
Problem: The heights of 12th-grade students are normally distributed with cm and cm. What is the probability that a randomly selected student is taller than 175 cm? Solution:
- Calculate -score:
- Look up in the Z-table:
- or 6.68%.
Answer: The probability is 6.68%.
Graph of Normal Distribution
Applications in Business
- Quality control (e.g., tolerances in manufacturing).
- Finance (e.g., stock price movements).
- Human resources (e.g., employee performance scores).
4. Other Distributions (Brief Overview)
| Distribution | Use Case | Formula/Key Feature |
|---|---|---|
| Exponential | Time between events (e.g., machine failures) | |
| Uniform | All outcomes equally likely (e.g., random numbers) | for |
| Hypergeometric | Sampling without replacement (e.g., lottery) |
Exam Tip: How to Score Full Marks
Understand Definitions:
- NEB often asks: "Define binomial distribution" or "When is Poisson used?"
- Example Answer:
"Binomial distribution is a discrete probability distribution that models the number of successes in a fixed number of independent trials, each with two possible outcomes (success/failure)."
Show All Steps in Calculations:
- Write down the formula, substitute values, and simplify.
- Example: For in binomial, show:
Draw Graphs When Asked:
- Sketch bar charts for binomial/Poisson or curves for normal.
- Label axes and key points (e.g., mean, probability).
Apply to Real-World Scenarios:
- NEB loves word problems. Translate words into parameters (, , ).
- Example Question:
"A company’s past data shows 10% of orders are delayed. If 15 orders are placed, find the probability of exactly 3 delays." Solution: Binomial with , , .
Memorize Key Formulas:
- Binomial:
- Poisson:
- Normal:
Practice Z-Table Lookups:
- For normal distribution, always convert to and use the table.
NEB Board-Style Questions
Section A: Short Answer (1 mark each)
- Define probability distribution.
- State the conditions for a binomial distribution.
- What is the mean of a Poisson distribution?
- Write the formula for the standard normal variable .
- Give one real-life example of a normal distribution.
Section B: Long Answer (5–7 marks)
A factory produces packets of biscuits. The probability of a packet being underweight is 0.05. If 20 packets are selected at random, find the probability that:
- Exactly 2 packets are underweight.
- More than 3 packets are underweight. (Use binomial distribution.)
The number of accidents in a factory follows a Poisson distribution with an average of 2 accidents per month. Find the probability that:
- There will be no accidents next month.
- There will be at least 3 accidents next month.
The heights of students in a school are normally distributed with a mean of 150 cm and a standard deviation of 10 cm. Find the probability that a randomly selected student has a height:
- Between 140 cm and 160 cm.
- More than 170 cm.
Explain the difference between binomial and Poisson distributions with examples. When would you use each?
Summary Table: Which Distribution to Use?
| Scenario | Distribution | Parameters Needed |
|---|---|---|
| Fixed trials, two outcomes | Binomial | , |
| Rare events over time/space | Poisson | |
| Continuous, symmetric data | Normal | , |
| Sampling without replacement | Hypergeometric | , , , |
| Time between events | Exponential |
Final Notes
- Binomial is for "yes/no" scenarios with fixed trials.
- Poisson is for counting rare events (e.g., calls, defects).
- Normal is for continuous data like heights or test scores.
- Always check if the problem involves discrete (binomial/Poisson) or continuous (normal) data.
- Practice converting word problems into mathematical terms (e.g., "probability of success" = ).
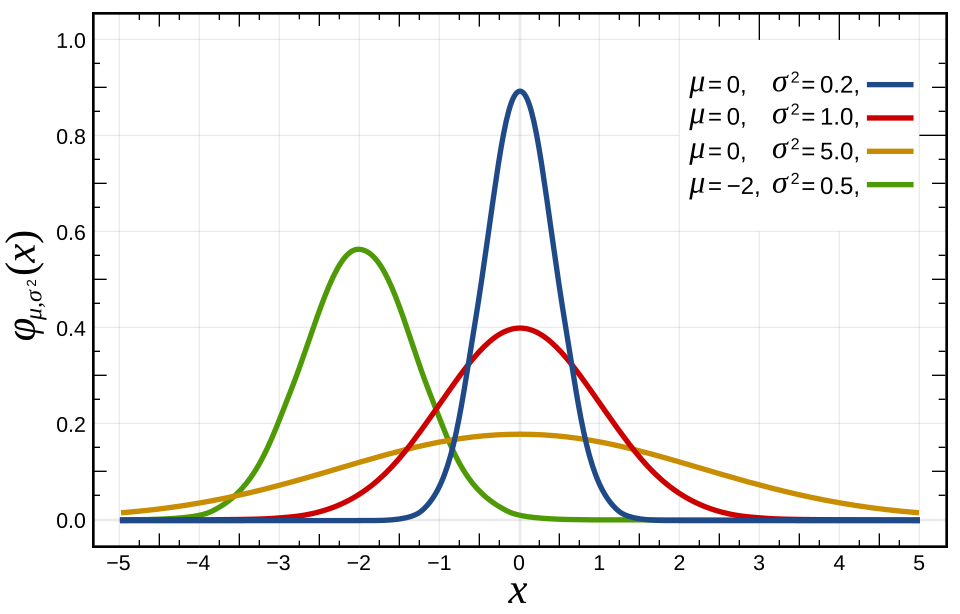 Bell curve labeled with μ and σ. (Image: Inductiveload, Public domain, via Wikimedia Commons)
Based on the NEB +2 Management syllabus for Business Mathematics (B. Maths), unit 9.
Discussion
Loading…