EconomicsUnit 18 min read
Utility Analysis & Indifference Curves: Consumer Choice & Preferences
Unit 1 of Economics explains how consumers make choices based on satisfaction (utility) and trade-offs between goods, using indifference curves, budget lines, and equilibrium points—key tools for NEB exams.
TAKEAWAYS:
- Utility measures satisfaction from consuming goods/services, but marginal utility shows how extra units add to it.
- Indifference curves map combinations of two goods that give equal satisfaction—steeper curves mean stronger preference for one good.
- The budget line shows affordable combinations; its slope equals the price ratio of goods.
- Consumer equilibrium occurs where the budget line is tangent to an indifference curve (highest satisfaction within budget).
- Diminishing marginal utility explains why people buy less of a good as they consume more.
- NEB loves graphs! Always draw indifference curves with downward slope, convex shape, and budget lines intersecting axes.
1. What is Utility?
Utility is the satisfaction or happiness a consumer gets from consuming goods/services.
- Total Utility (TU): Total satisfaction from all units consumed.
- Marginal Utility (MU): Extra satisfaction from one more unit of a good.
- If MU > 0 → More consumption increases satisfaction.
- If MU < 0 → Overconsumption leads to dissatisfaction (e.g., too many chocolates).
Why does MU decrease? As you consume more of a good, each additional unit gives less extra satisfaction (law of diminishing marginal utility). Example:
| Units of Ice Cream | TU | MU (Change in TU) |
|---|---|---|
| 1 | 10 | 10 |
| 2 | 18 | +8 |
| 3 | 24 | +6 |
| 4 | 28 | +4 |
| 5 | 30 | +2 |
2. Indifference Curves: Mapping Preferences
An indifference curve shows combinations of two goods (X and Y) that give the same satisfaction. Key Properties:
- Downward slope: More of one good means less of the other (trade-off).
- Convex to origin: Shows diminishing marginal rate of substitution (MRS)—you’re willing to give up less of Y for each extra X as you have more X.
- Higher curves = higher satisfaction: IC₂ > IC₁ means more satisfaction.
Why are they convex?
- Early trades (e.g., 10X for 1Y) are steep because you’re giving up a lot for a little.
- Later trades (e.g., 1X for 10Y) are flatter because you’re less willing to sacrifice Y.
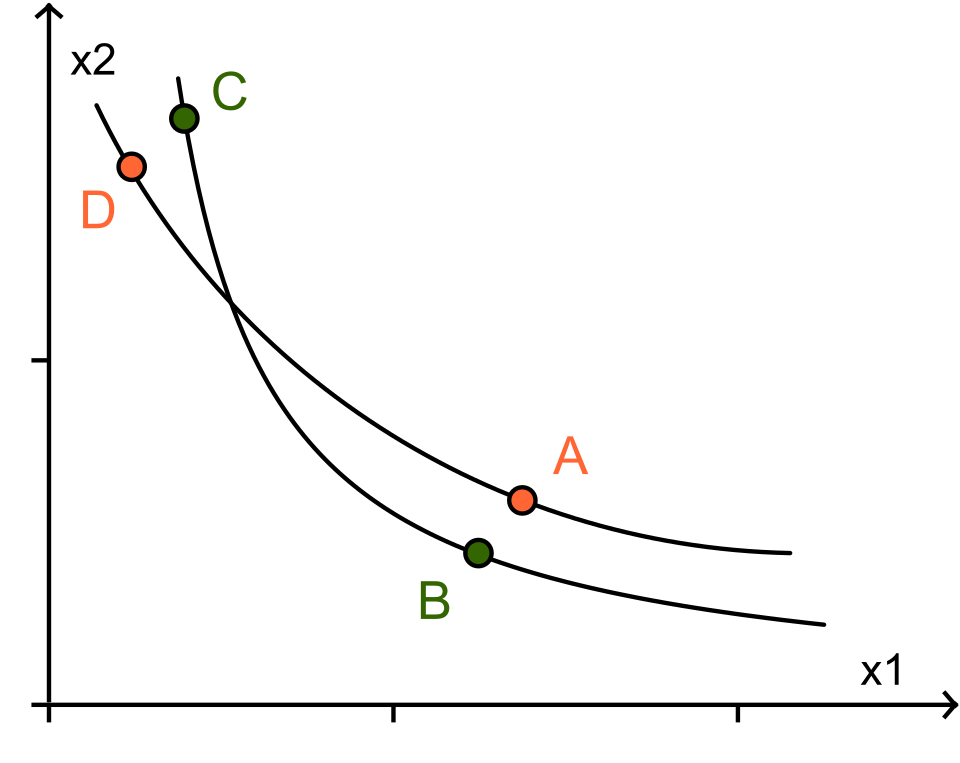 IC₁ < IC₂: Higher satisfaction as you move up. (Image: Pill, CC0, via Wikimedia Commons)
3. Budget Line: Affordable Choices
The budget line shows all combinations of two goods a consumer can buy with a fixed income (M) and given prices (Pₓ, Pᵧ). Equation: Slope of budget line = –(Pₓ / Pᵧ) (price ratio).
Example:
- Income (M) = Rs. 100
- Price of X (Pₓ) = Rs. 10
- Price of Y (Pᵧ) = Rs. 20 Budget line equation: Intercepts:
- X-axis: (10 units of X)
- Y-axis: (5 units of Y)
4. Consumer Equilibrium: Where Preferences Meet Budget
Consumer equilibrium occurs where:
- The budget line is tangent to the indifference curve (highest possible satisfaction).
- MUₓ / Pₓ = MUᵧ / Pᵧ (utility per rupee spent is equal for both goods).
Why?
- If MUₓ/Pₓ > MUᵧ/Pᵧ → Buy more X (better "bang for buck").
- If MUₓ/Pₓ < MUᵧ/Pᵧ → Buy more Y.
Example:
| Good | MU | Price (P) | MU/P |
|---|---|---|---|
| X | 10 | 5 | 2 |
| Y | 20 | 10 | 2 |
| Conclusion: Consumer is in equilibrium (MUₓ/Pₓ = MUᵧ/Pᵧ = 2). |
5. Shifts in Budget Line and Indifference Curves
| Change | Effect on Budget Line | Effect on Consumer Choice |
|---|---|---|
| Income increases | Shifts right (parallel) | Moves to higher IC (more satisfaction) |
| Price of X falls | Rotates outward (steeper slope) | More X bought, less Y |
| Price of Y rises | Rotates inward (flatter slope) | Less Y bought, more X |
Example:
- Initially: M = Rs. 100, Pₓ = Rs. 10, Pᵧ = Rs. 20.
- After income rises to Rs. 200: New budget line: New intercepts: (20,0) and (0,10). Result: Consumer moves to a higher indifference curve.
6. Marginal Rate of Substitution (MRS)
MRS is the rate at which a consumer is willing to substitute Y for X while staying on the same indifference curve.
- Formula:
- Graphically: Slope of the indifference curve at any point.
Example: If a consumer is willing to give up 2 units of Y to get 1 more X, then:
Why does MRS decrease? As you move down the indifference curve (more X, less Y), you become less willing to give up Y for X.
7. Real-World Applications
- Fast Food Choices:
- A student may trade pizza slices for burgers based on hunger and budget.
- Subsidies:
- If the government reduces the price of rice (X), the budget line rotates outward → more rice consumed.
- Advertising:
- Ads shift preferences (indifference curves rotate outward for advertised goods).
NEB-Style Questions & Solutions
Short Answer (2 marks)
Q1: What is the law of diminishing marginal utility? Give an example. Answer: The law states that as a consumer buys more units of a good, the additional satisfaction (MU) from each extra unit decreases. Example: Eating more samosas—first samosa gives high satisfaction, but the 5th samosa may cause discomfort.
Long Answer (5 marks)
Q2: Explain the conditions for consumer equilibrium with the help of a diagram. Why is it called "equilibrium"? Answer: Conditions for Consumer Equilibrium:
- Budget constraint:
- Utility maximization:
- Tangency condition: Budget line touches the highest possible indifference curve.
Diagram:
```mermaid
graph TD
    A["Budget Line"] -->|Tangent at| B["Highest IC"]
    B --> C["Consumer Equilibrium"]
    C --> D["Max Satisfaction"]
Why "Equilibrium"?
- No incentive to change choice (no better combination within budget).
- If disturbed (e.g., price change), consumer adjusts to restore equilibrium.
Numerical (3 marks)
Q3: A consumer has Rs. 200 to spend on apples (Pₐ = Rs. 20) and oranges (Pₒ = Rs. 10). Draw the budget line and show the intercepts. Solution:
- Budget equation: ( 20A + 10O = 200 )
- Intercepts:
- Apples (A): ( O = 0 \Rightarrow A = 10 )
- Oranges (O): ( A = 0 \Rightarrow O = 20 )
- Graph:
Exam Tip
✅ NEB loves diagrams! Always draw:
- Indifference curves (downward-sloping, convex).
- Budget lines (intercepts on axes, slope = –Pₓ/Pᵧ).
- Consumer equilibrium (tangency point).
✅ Key formulas to remember:
✅ Common mistakes to avoid:
- Drawing indifference curves upward-sloping (wrong!).
- Forgetting diminishing MRS (curves should be convex).
- Ignoring units in numerical problems (always check intercepts).
Final Note: Utility analysis helps explain real-world choices—from buying groceries to government policies. Master the graphs, and you’ll ace NEB questions! 🚀
Based on the NEB +2 Management syllabus for Economics (Eco), unit 1.
Discussion
Loading…