Basics of Managerial AccountingUnit 311 min read
Cost-Volume-Profit Analysis: Break-even, Margin & Decision Tools
Unit 3 of Basics of Managerial Accounting covers how businesses determine profit relationships between costs, sales volume, and pricing to make strategic decisions—key for startups like Daraz or local shops in Kathmandu.
Core Concepts & Definitions
1. Cost-Volume-Profit (CVP) Relationship
The CVP analysis examines how changes in costs, volume (sales units), and pricing affect a company’s profit. It helps managers:
- Set selling prices
- Determine production levels
- Assess profitability under different scenarios
Key Terms
| Term | Definition | Formula (if any) |
|---|---|---|
| Fixed Costs (FC) | Costs that do not change with production (e.g., rent, salaries). | |
| Variable Costs (VC) | Costs that vary directly with production (e.g., raw materials, direct labor). | |
| Total Cost (TC) | Sum of fixed + variable costs. | |
| Contribution Margin | Revenue after covering variable costs; contributes to covering fixed costs and profit. | |
| Break-even Point (BEP) | The sales volume where total revenue = total costs (profit = 0). | |
| Margin of Safety (MoS) | The excess sales above break-even; indicates how much sales can drop before losses occur. | |
| Operating Leverage | Measures how fixed costs amplify changes in profit when sales change. |
2. The CVP Equation & Break-even Analysis
The CVP equation is the foundation of this analysis: At break-even, profit = 0: Rearranged to find BEP in units:
Worked Example: Kathmandu Tea Shop
Scenario: A small tea shop in Thamel sells masala chai at ₹50 per cup.
- Fixed Costs (FC): ₹15,000/month (rent, salaries)
- Variable Cost per Cup (VC): ₹10 (milk, tea leaves, sugar)
- Current Sales: 500 cups/month
Step 1: Calculate Contribution Margin (CM)
Step 2: Find Break-even Point (BEP) in Units
Interpretation: The shop must sell 375 cups to cover all costs.
Step 3: Calculate Current Profit
Step 4: Margin of Safety (MoS)
Interpretation: The shop can sell 125 fewer cups before breaking even.
3. Graphical Representation of CVP
graph TD
    A["Total Revenue (TR)"] -->|"Linear, upward slope"| B["Sales Volume (Q)"]
    C["Total Cost (TC)"] -->|"Fixed Costs + Variable Costs"| D["Sales Volume (Q)"]
    E["Break-even Point"] -->|"Where TR = TC"| F["Profit Zone"]
    G["Loss Zone"] -->|"Where TR < TC"| H["Below BEP"]
    I["Profit Zone"] -->|"Where TR > TC"| J["Above BEP"]
Key Observations:
- TR (Total Revenue) is a straight line starting from the origin.
- TC (Total Cost) is a straight line starting at FC (y-intercept).
- The intersection point = Break-even Point.
- Above BEP = Profit.
- Below BEP = Loss.
In the Real World
Daraz (Nepal’s Amazon)
- Uses CVP analysis to decide minimum order quantities for sellers.
- Example: If Daraz’s fixed costs for a product category are ₹500,000 and the contribution margin per item is ₹200, the break-even sales volume is 2,500 units. Sellers must meet this to avoid losses.
Ncell (Telecom Operator)
- Applies CVP to set prepaid vs. postpaid pricing.
- Example: If Ncell’s fixed costs for a data plan are ₹10 million and the variable cost per GB is ₹5, the break-even data sales (at ₹20/GB) is 500,000 GB. This helps them decide discount strategies.
Khalti (Digital Payment App)
- Uses CVP to determine transaction fees.
- Example: If Khalti’s fixed costs for processing payments are ₹2 million/month and the variable cost per transaction is ₹2, the break-even transactions (at ₹10/transaction fee) is 200,000 transactions. This guides their merchant fee structure.
4. Assumptions of CVP Analysis
CVP analysis relies on simplifying assumptions. While useful, these must be considered:
| Assumption | Limitation |
|---|---|
| Linear revenue & cost functions | Real-world costs may not be strictly linear (e.g., bulk discounts). |
| Fixed costs remain constant | Some "fixed" costs (e.g., overtime) may change with volume. |
| Sales mix is constant | Applies only if products have the same CM ratio (not true for mixed products). |
| No inventory changes | Assumes all produced units are sold (no unsold stock). |
| Single product or constant mix | Fails for companies selling multiple products with different CM ratios. |
5. Applications of CVP Analysis
A. Pricing Decisions
- Helps set minimum prices to cover costs.
- Example: A Kathmandu furniture shop selling chairs at ₹2,000 with ₹1,200 variable cost and ₹50,000 fixed costs must sell 50 chairs to break even.
B. Production Decisions
- Determines optimal production levels.
- Example: A biscuit factory with ₹100,000 fixed costs and ₹5 CM per biscuit needs to sell 20,000 biscuits to break even.
C. Profit Planning
- Estimates profit at different sales volumes.
- Example: If a Thamel restaurant sells 1,000 meals/month at ₹500 each with ₹200 variable cost and ₹100,000 fixed costs, its profit is:
D. Special Order Decisions
- Evaluates one-time orders below normal selling price.
- Example: A Daraz seller gets an offer for 1,000 units at ₹500 (normal price: ₹800, variable cost: ₹300).
- CM per unit: ₹500 - ₹300 = ₹200
- Total CM: ₹200,000
- Decision: Accept if additional fixed costs (e.g., shipping) < ₹200,000.
6. Limitations & Criticisms
While powerful, CVP analysis has real-world constraints:
| Limitation | Explanation |
|---|---|
| Ignores inventory levels | Assumes all production is sold (not true for seasonal businesses). |
| Fixed costs may not be truly fixed | Some costs (e.g., maintenance) vary with usage. |
| No consideration for competition | Pricing may be influenced by rivals, not just internal costs. |
| Short-term focus | Long-term strategies (e.g., R&D) are ignored. |
| Assumes constant sales mix | Multi-product firms must adjust for different CM ratios. |
7. Advanced: Multi-Product CVP Analysis
When a company sells multiple products, the weighted average contribution margin is used.
Example: A Kathmandu Café Selling Tea & Coffee
| Product | Selling Price | Variable Cost | CM per Unit | Sales Mix (%) |
|---|---|---|---|---|
| Tea | ₹50 | ₹10 | ₹40 | 60% |
| Coffee | ₹80 | ₹20 | ₹60 | 40% |
Step 1: Calculate Weighted Average CM
(Here, 1 "unit" = 60% tea + 40% coffee.)
Step 2: Find Break-even in "Units"
Interpretation: The café must sell 312.5 "units" (≈ 187.5 tea + 125 coffee) to break even.
8. Exam Tip: How to Score Full Marks
Common Exam Questions & How to Answer
Calculate Break-even Point (BEP)
- What examiners want: Correct formula, clear steps, and units (not just money).
- How to answer:
- Write the CVP equation.
- Calculate CM per unit.
- Use .
- Always state the answer in units (e.g., "375 cups").
Determine Profit at a Given Sales Volume
- What examiners want: Correct profit calculation using SP × Q – (FC + VC × Q).
- How to answer:
- Calculate total revenue (SP × Q).
- Calculate total variable cost (VC × Q).
- Subtract FC and TVC from TR.
Margin of Safety (MoS) Questions
- What examiners want: Difference between actual sales and BEP.
- How to answer:
- First, find BEP in units.
- Subtract from actual sales.
- Express as a percentage if asked (e.g., "MoS is 25% of sales").
Special Order Decisions
- What examiners want: Whether to accept/reject based on additional CM.
- How to answer:
- Calculate CM per unit for the special order.
- Check if additional FC (if any) is covered.
- Decision rule: Accept if CM > additional costs.
Graphical CVP Questions
- What examiners want: A correctly labeled graph with TR, TC, and BEP.
- How to answer:
- Draw TR as a straight line from origin.
- Draw TC as a straight line starting at FC.
- Mark BEP where lines intersect.
- Shade profit and loss zones.
Final Checklist Before Submission
✅ Units: Always specify whether BEP is in units, rupees, or percentage. ✅ Formulas: Write the CVP equation clearly. ✅ Assumptions: Mention if the question involves single vs. multi-product. ✅ Real-world tie: Relate answers to Nepali businesses (e.g., Daraz, Khalti, local shops). ✅ Graphs: If asked for a graph, label axes, lines, and BEP.
Practice Question (Solve Before Exam)
Scenario: A Pokhara electronics shop sells smartphones at ₹30,000 each.
- Fixed Costs: ₹5,000,000/year (rent, salaries)
- Variable Cost per Phone: ₹15,000
- Current Sales: 300 phones/year
Questions:
- Calculate the break-even point in units.
- Determine the profit at current sales.
- If the shop wants a ₹2,000,000 profit, how many phones must it sell?
- What is the margin of safety in units and percentage?
Answer Structure:
- BEP in units:
- Current Profit:
- Phones for ₹2M Profit:
- Margin of Safety: (If sales were 400 phones: MoS = 400 - 333.33 = 66.67 units)
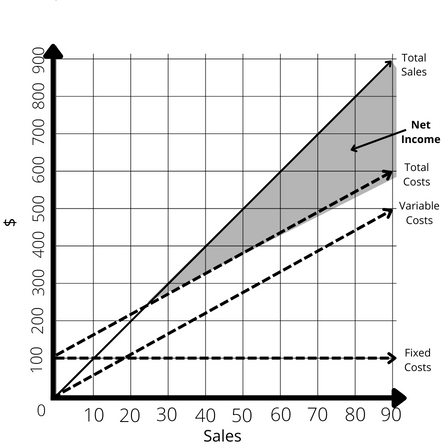 A labeled CVP graph showing TR, TC, and BEP for a Nepali business. (Image: Slade74, CC0, via Wikimedia Commons)
Based on the PU BBA (PU) syllabus for Basics of Managerial Accounting, unit 3.
Discussion
Loading…