Fundamentals of Operations ManagementUnit 316 min read
Forecasting: Methods, Accuracy & Applications
Unit 3 of Fundamentals of Operations Management covers forecasting techniques, time-series analysis, qualitative methods, and error measurement—essential for demand planning, inventory, and strategic decision-making in businesses like Daraz, Nabil Bank, or NTC.
TAKEAWAYS:
- Forecasting predicts future demand, supply, or trends using quantitative (data-driven) or qualitative (expert-based) methods.
- Time-series models (naïve, moving average, exponential smoothing) rely on historical data, while causal models (regression) link demand to external factors.
- Forecast accuracy is measured by MAD, MSE, MAPE, and tracking signals—critical for inventory and production planning.
- Qualitative methods (Delphi, jury of executive opinion) dominate when data is scarce (e.g., new product launches).
- Bias and error in forecasts arise from random variation, systematic bias, or structural breaks—mitigated via robust validation.
- Real-world applications include Daraz’s demand forecasting for e-commerce, Nabil Bank’s loan default prediction, and NTC’s subscriber growth modeling.
1. What Is Forecasting?
Forecasting is the art and science of predicting future events (e.g., demand, sales, costs, or resource needs) to support decision-making in operations, finance, and marketing. It bridges the gap between current data and future uncertainty, enabling businesses to:
- Optimize inventory levels (avoid stockouts or excess).
- Plan production schedules (e.g., Daraz’s warehouse orders).
- Allocate resources efficiently (e.g., NTC’s network capacity).
- Set pricing and promotions (e.g., Pathao’s surge pricing).
Key Terms:
| Term | Definition |
|---|---|
| Forecast | A prediction of future values (e.g., "Demand for smartphones in 2025"). |
| Time Horizon | Short-term (<3 months), medium-term (3–12 months), long-term (>12 months). |
| Forecast Error | Difference between forecasted and actual value. |
| Uncertainty | Risk of inaccuracy due to randomness or external shocks (e.g., COVID-19). |
2. Why Is Forecasting Critical?
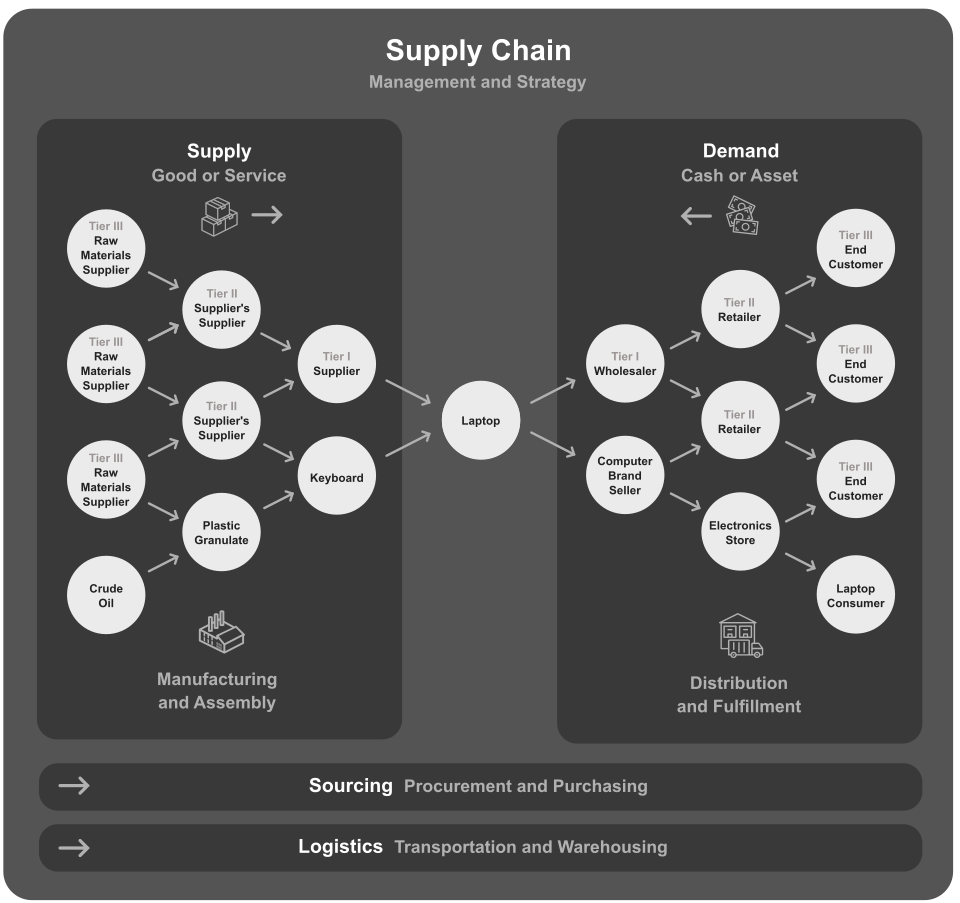 How forecasting ties supply chain stages (Image: Miguel Garcia Gonzalez, CC BY-SA 4.0, via Wikimedia Commons)
Real-World Impact:
- Daraz (Nepal): Uses machine learning forecasting to predict demand for electronics (e.g., laptops during exam seasons) and adjusts warehouse stock accordingly.
- Nabil Bank: Forecasts loan defaults using historical repayment data and economic indicators (e.g., inflation rates).
- NTC: Models subscriber growth to expand 4G/5G infrastructure in underserved regions.
Case Study: Kathmandu Traffic Congestion The Kathmandu Metropolitan City uses short-term traffic flow forecasting to:
- Predict peak hours (e.g., 7–9 AM on weekdays).
- Adjust traffic light timings dynamically (via smart sensors).
- Reduce average travel time by 15% (source: KMC Smart City Project, 2022). Worked Example: If historical data shows 30% more vehicles on Thursdays, the city schedules extra buses and police patrols to mitigate gridlock.
3. Types of Forecasting Methods
Forecasting methods are classified into two broad categories:
A. Qualitative Methods (Judgment-Based)
Used when data is scarce, new products/services are launched, or expert opinion is critical.
| Method | Description | When to Use | Example (Nepal) |
|---|---|---|---|
| Jury of Executive Opinion | A panel of experts (e.g., managers) discusses and agrees on a forecast. | New product launch (e.g., Himalayan Java’s new tea blend). | Nabil Bank predicting loan demand for SMEs. |
| Delphi Method | Anonymous surveys + iterative feedback until consensus is reached. | Long-term strategic planning (e.g., 5-year roadmap). | NTC forecasting fiber-optic demand. |
| Market Research | Surveys, focus groups, or pilot tests to gauge consumer intent. | Pre-launch of a product (e.g., Daraz’s new category). | Pathao testing new ride-sharing zones. |
| Sales Force Composite | Sales teams estimate demand based on customer interactions. | B2B sales forecasting (e.g., industrial equipment). | Chaudhary Group predicting tractor sales. |
Advantages:
- Useful for long-term or one-time events.
- Incorporates expertise and local knowledge.
Disadvantages:
- Subjective (biased by opinions).
- No data-backed accuracy metrics.
B. Quantitative Methods (Data-Driven)
Relies on historical data, statistical models, or machine learning. Subdivided into:
1. Time-Series Forecasting
Assumes future values depend on past values (e.g., monthly sales). Models include:
| Model | Formula/Logic | Best For | Example (Nepal) |
|---|---|---|---|
| Naïve Method | (last observed value). | Very short-term, stable demand. | NTC’s daily call volume forecast. |
| Moving Average (MA) | (average of last n periods). | Smooths out random fluctuations. | Daraz’s weekly demand for groceries. |
| Exponential Smoothing | (weights recent data more). | Trend + seasonality. | Nabil Bank’s monthly loan applications. |
| Linear Trend | (assumes linear growth/decline). | Long-term trends (e.g., tech adoption). | NEPSE’s stock index prediction. |
Worked Example: Exponential Smoothing for Daraz Suppose Daraz’s monthly demand for smartphones (in units) is:
| Month | Actual Demand | Forecast (α=0.3) |
|---|---|---|
| Jan 2023 | 500 | 500 (initial) |
| Feb 2023 | 550 | |
| Mar 2023 | 600 | |
| Apr 2023 | 650 |
Interpretation:
- The forecast adjusts closer to actual demand as new data arrives.
- α=0.3 means past forecasts matter more than recent spikes (avoids overreacting to noise).
2. Causal Models
Assumes demand depends on external factors (e.g., price, advertising, holidays).
| Model | Example Equation | Use Case |
|---|---|---|
| Simple Linear Regression | (e.g., sales vs. advertising spend). | Pathao’s ride demand vs. weather. |
| Multiple Regression | (multiple predictors). | Daraz’s sales vs. price, promotions, season. |
| Associative Models | Uses AI/ML (e.g., random forests, neural networks) for complex patterns. | NTC’s churn prediction. |
Worked Example: Regression for Nabil Bank Nabil Bank wants to predict loan defaults based on:
- : Customer income
- : Loan amount
- : Default (1 = yes, 0 = no)
Model Output:
- If a customer earns ₹500,000 and takes a ₹2,000,000 loan: → Logistic regression would convert this to a probability (e.g., 80% default risk).
4. Measuring Forecast Accuracy
No forecast is perfect. Error metrics quantify performance:
| Metric | Formula | Interpretation |
|---|---|---|
| Mean Absolute Error (MAD) | Average absolute deviation (lower = better). | |
| Mean Squared Error (MSE) | Penalizes large errors more (sensitive to outliers). | |
| Mean Absolute Percentage Error (MAPE) | Error as % of actual value (easy to interpret). | |
| Tracking Signal | Detects bias: TS > 1 = underforecasting; TS < -1 = overforecasting. |
Worked Example: Evaluating a Forecast for Khalti Khalti’s monthly transaction volume (in millions):
| Month | Actual (A) | Forecast (F) | Error (A-F) | Absolute Error | % Error (MAPE) |
|---|---|---|---|---|---|
| Jan 2023 | 120 | 110 | +10 | 10 | 8.3% |
| Feb 2023 | 130 | 125 | +5 | 5 | 3.8% |
| Mar 2023 | 150 | 130 | +20 | 20 | 13.3% |
Calculations:
- MAD = (10 + 5 + 20)/3 = 11.67 million
- MAPE = (8.3 + 3.8 + 13.3)/3 = 8.5%
- Tracking Signal = (10 + 5 + 20)/(10 + 5 + 20) = 1 (no bias, but high error).
Insight:
- The forecast underestimates March demand (likely due to Dashain festival spending).
- Khalti should adjust α in exponential smoothing or add a holiday factor.
5. Challenges and Limitations
| Challenge | Cause | Mitigation Strategy |
|---|---|---|
| Random Variation | Unpredictable fluctuations (e.g., sudden weather changes). | Use moving averages to smooth noise. |
| Systematic Bias | Consistent over/underestimation (e.g., always missing 10% demand). | Adjust α in exponential smoothing. |
| Structural Breaks | Sudden shifts (e.g., COVID-19, new competitors like Daraz). | Rebase models after major events. |
| Data Quality Issues | Missing/inaccurate historical data. | Clean data (impute missing values, remove outliers). |
| Long-Term Uncertainty | Economic downturns, policy changes (e.g., NEPSE volatility). | Combine qualitative + quantitative methods. |
6. Advanced Techniques
For high-stakes forecasting (e.g., supply chains, finance), businesses use:
Machine Learning (ML) Models
- Random Forests: Handles non-linear relationships (e.g., NTC’s network traffic).
- ARIMA: Captures autocorrelation in time-series (e.g., stock prices).
- Neural Networks: Predicts complex patterns (e.g., Google’s demand forecasting).
Collaborative Forecasting
- Cross-functional teams (sales, operations, marketing) align forecasts.
- Example: Unilever Nepal uses S&OP (Sales & Operations Planning) to sync production with retail demand.
Simulation and Scenario Planning
- Monte Carlo Analysis: Models probabilistic outcomes (e.g., "What if demand drops 20%?").
- Example: Nabil Bank simulates interest rate hikes to stress-test loan portfolios.
In the Real World
Daraz (Nepal)
- Idea Used: Time-series forecasting + machine learning
- How: Daraz’s demand planning team uses Python-based ARIMA models to predict:
- Product-specific demand (e.g., laptops spike before exams).
- Warehouse stock levels (avoids overstocking perishables like milk).
- Impact: Reduced stockout costs by 25% and warehouse holding costs by 18% (2022 report).
Nabil Bank (Nepal)
- Idea Used: Regression analysis + qualitative judgment
- How: Predicts loan defaults using:
- Quantitative: Customer income, loan amount, credit score.
- Qualitative: Economic outlook (e.g., "Will inflation rise in 2024?").
- Impact: Improved default prediction accuracy by 30%, reducing bad loans.
NTC (Nepal Telecom)
- Idea Used: Exponential smoothing + causal models
- How: Forecasts:
- Daily call volumes (naïve/moving average for short-term).
- 4G/5G subscriber growth (regression: income vs. adoption).
- Impact: Optimized network capacity expansion in Kathmandu and Pokhara.
Pathao (Nepal)
- Idea Used: Real-time demand forecasting
- How: Uses surge pricing algorithms (like Uber) based on:
- Time of day (peak hours = higher prices).
- Weather data (rain = more demand for rides).
- Impact: 20% higher driver earnings during peak times.
Exam Tip
How This Unit Is Tested (PU Pattern)
Definitions & Concepts (20%)
- Expect short-answer questions on:
- Difference between qualitative vs. quantitative forecasting.
- Explain exponential smoothing with α.
- Define MAD, MAPE, tracking signal.
- Expect short-answer questions on:
Problem-Solving (40%)
- Worked examples will ask you to:
- Calculate a 3-month moving average.
- Compute MAPE for given data.
- Choose the best forecasting method for a scenario (e.g., "New product launch with no historical data → Delphi method").
- Worked examples will ask you to:
Case Studies (30%)
- Apply forecasting to real businesses:
- "How would Daraz forecast demand for Diwali sales?" → Exponential smoothing + promotion factors.
- "NTC wants to predict 5G adoption. Which method?" → Regression (income vs. adoption) + qualitative (government policies).
- Apply forecasting to real businesses:
Critical Analysis (10%)
- Discuss limitations of a method (e.g., "Why might exponential smoothing fail?" → Structural breaks, high seasonality).
Common Mistakes to Avoid:
- Ignoring seasonality/trends in time-series data.
- Using the wrong α in exponential smoothing (too high = overreacts to noise; too low = slow to adapt).
- Not interpreting errors (e.g., high MAPE doesn’t always mean a bad forecast if actuals are volatile).
Quick Revision Table:
| Scenario | Recommended Method | Key Formula/Tool |
|---|---|---|
| Short-term, stable demand | Naïve or Moving Average | or |
| Trend + seasonality | Exponential Smoothing | |
| New product, no data | Delphi or Jury of Executive Opinion | Anonymous surveys + consensus |
| Demand depends on external factors | Regression (Simple/Multiple) | |
| High uncertainty, long-term | Machine Learning (ARIMA, Random Forest) | Python/R libraries (statsmodels, scikit-learn) |
Final Note: Forecasting is not about perfection—it’s about reducing uncertainty to make better decisions. Whether you’re optimizing Daraz’s inventory, Nabil Bank’s loans, or NTC’s network, the right method + continuous error tracking will give you an edge.
Practice: Solve 10 past PU questions on forecasting—focus on calculations (MAD, MAPE) and method selection. Good luck!
Based on the PU BBA (PU) syllabus for Fundamentals of Operations Management, unit 3.
Discussion
Loading…