InstrumentationUnit 112 min read
Measurement Fundamentals: Systems, Standards, and Accuracy
Unit 1 of Instrumentation covers the core principles of measurement systems, including definitions, components, standards, and error analysis. It explains how measurements are taken, classified, and standardized, with real-world applications in engineering and daily life.
TAKEAWAYS:
- An instrumentation system consists of sensors, signal conditioners, converters, and displays, all working together to measure physical quantities accurately.
- Measurement standards (like SI units) ensure consistency and comparability across instruments and industries.
- Static and dynamic measurements differ in how they handle time-varying signals (e.g., temperature vs. vibration).
- Error types (systematic, random, gross) affect measurement accuracy, and calibration reduces their impact.
- Transducer selection depends on the physical quantity to be measured (e.g., LVDT for displacement, thermocouples for temperature).
- Real-world applications include traffic monitoring (speed sensors), medical diagnostics (ECG machines), and financial transactions (ATM card readers).
1. What is Measurement?
Measurement is the process of quantifying a physical quantity (e.g., length, temperature, pressure) using an instrument or system. It is fundamental in engineering, science, and industry to ensure precision, safety, and efficiency.
1.1 Types of Measurements
Measurements are classified based on their nature and application:
| Type | Definition | Example |
|---|---|---|
| Static Measurement | Measures quantities that do not change with time (steady-state). | Measuring room temperature with a thermometer. |
| Dynamic Measurement | Measures quantities that vary with time (transient or periodic). | Recording heart rate using an ECG machine. |
| Direct Measurement | The quantity is measured directly by the instrument. | Using a ruler to measure length. |
| Indirect Measurement | The quantity is derived from other measurable quantities. | Calculating speed from distance and time (speed = distance/time). |
| Absolute Measurement | Uses a fixed reference standard (e.g., SI units). | Measuring length with a calibrated meter scale. |
| Relative Measurement | Compares the quantity to a known reference (not necessarily SI). | Using a voltmeter to compare two voltages. |
1.2 Measurement Standards
Standards ensure uniformity and accuracy in measurements. The most widely used system is the International System of Units (SI), which defines:
- Base units (meter, kilogram, second, ampere, kelvin, mole, candela).
- Derived units (e.g., watt for power, pascal for pressure).
- Prefixes (kilo-, milli-, micro-) for scaling.
Why Standards Matter?
- Global compatibility: A product designed in Nepal can be manufactured in Germany without recalibration.
- Legal compliance: Many industries (e.g., pharmaceuticals, aviation) require standardized measurements.
- Scientific reproducibility: Experiments must yield the same results worldwide.
2. Components of an Instrumentation System
An instrumentation system converts a physical quantity into a usable signal (e.g., electrical) for display or analysis. The block diagram below shows its key components:
2.1 Key Components Explained
| Component | Function | Example |
|---|---|---|
| Sensor/Transducer | Converts physical quantity into an electrical signal. | Thermocouple (temperature → voltage), LVDT (displacement → voltage). |
| Signal Conditioning | Prepares the signal for further processing (amplification, filtering). | Operational amplifiers, filters to remove noise. |
| Signal Conversion | Converts analog signals to digital (A/D) or vice versa (D/A). | ADC in microcontrollers, DAC in audio systems. |
| Data Processing | Analyzes, stores, or transmits data (e.g., via algorithms). | Microcontrollers (Arduino, Raspberry Pi), SCADA systems. |
| Display/Recording | Shows or stores the measured data for the user. | LCD screens, printers, cloud storage. |
3. Measurement Errors and Calibration
No measurement is perfect; errors arise due to instrument limitations, environmental factors, or human mistakes.
3.1 Types of Errors
| Error Type | Cause | Example |
|---|---|---|
| Systematic Error | Consistent and repeatable bias in measurements. | A scale that always shows 1 kg more than the actual weight. |
| Random Error | Unpredictable fluctuations due to noise or environmental changes. | Variations in voltage readings due to electrical interference. |
| Gross Error | Human mistakes (misreading, incorrect setup). | Recording a temperature as 30°C instead of 23°C due to a typo. |
3.2 Reducing Errors: Calibration
Calibration adjusts an instrument to match a known standard, reducing systematic errors. Steps in Calibration:
- Compare the instrument’s reading with a reference standard.
- Adjust (e.g., tweak a potentiometer, apply software corrections).
- Record the corrections for future use.
Example: Calibrating a Pressure Sensor
- Step 1: Apply a known pressure (e.g., 100 kPa) using a deadweight tester.
- Step 2: If the sensor reads 105 kPa, adjust its gain until it reads 100 kPa.
- Step 3: Repeat for multiple points (e.g., 50 kPa, 150 kPa) and plot a correction curve.
4. Static vs. Dynamic Measurements
| Feature | Static Measurement | Dynamic Measurement |
|---|---|---|
| Signal Nature | Constant or slowly varying. | Rapidly changing (periodic or transient). |
| Example | Measuring water level in a tank. | Recording engine vibrations during a car test. |
| Instrument Requirement | High accuracy, low response time. | Fast response time, bandwidth considerations. |
| Error Concern | Hysteresis (lag in response). | Phase lag, frequency response. |
Worked Example: Static vs. Dynamic in Traffic Monitoring
- Static: Measuring average speed on a road using speed cameras (constant speed).
- Dynamic: Recording speed fluctuations of vehicles passing a sensor (varying speeds).
5. Real-World Applications
5.1 eSewa and Khalti (Digital Payments)
- Measurement Idea: Timing and transaction validation.
- How It Works:
- When you pay via eSewa, the system measures transaction time (in milliseconds) to detect fraud.
- Signal conditioning: The app checks for signal integrity (e.g., no glitches in the payment request).
- Error handling: If a transaction takes >2 seconds, it flags a possible man-in-the-middle attack.
5.2 Pathao (Ride-Hailing)
- Measurement Idea: Distance and time tracking.
- How It Works:
- The app uses GPS sensors (dynamic measurement) to track the driver’s speed and distance.
- Signal conversion: GPS coordinates are converted to digital signals for mapping.
- Error reduction: Kalman filters (a signal processing technique) reduce GPS noise for accurate routing.
5.3 NTC (Electricity Billing)
- Measurement Idea: Energy consumption monitoring.
- How It Works:
- Static measurement: The energy meter records total kWh consumed (steady-state).
- Dynamic measurement: Smart meters detect power surges (transient spikes) to prevent damage.
- Calibration: Meters are calibrated annually to ensure billing accuracy.
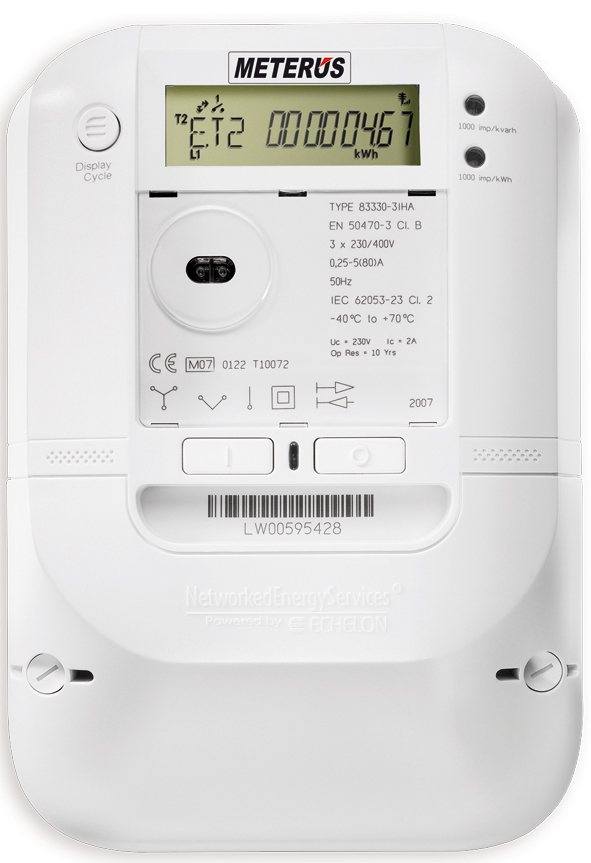 A modern digital meter showing voltage, current, and energy readings. (Image: EVB Energy Ltd (no mention of the photographer required), CC BY-SA 3.0, via Wikimedia Commons)
6. Worked Example: LVDT for Directional Movement
Problem: Explain how an LVDT (Linear Variable Differential Transformer) measures the direction of movement.
Solution:
- Principle: An LVDT works on electromagnetic induction. It has:
- A primary coil (excited by AC voltage).
- Two secondary coils (connected in series opposition).
- Operation:
- A ferromagnetic core moves inside the coils.
- When the core is centered, the output voltage is zero (balanced).
- When the core moves left or right, the voltage increases in phase (indicating direction).
- Output:
- Positive voltage: Core moves to the right.
- Negative voltage: Core moves to the left.
- Magnitude of voltage: Proportional to displacement.
Application in Nepal:
- Traffic Light Control Systems: LVDTs measure the position of traffic light arms to ensure they switch at the correct time.
- Industrial Automation: Used in hydraulic presses to control piston movement precisely.
Exam Tip
- Block Diagrams: Always draw the instrumentation system block diagram when asked about components. Label each block clearly.
- Error Analysis: For questions on errors, define systematic vs. random errors and explain how calibration helps.
- Real-World Links: Connect concepts to Nepali examples (e.g., NTC meters, Pathao GPS, eSewa transactions) to score extra marks.
- Units and Standards: Memorize SI units and their prefixes. Questions often test this.
- LVDT and Transducers: Know how LVDT measures direction (phase shift in voltage) and compare it with other transducers (e.g., strain gauges, thermocouples).
Key Formula to Remember:
- Relative Error =
- Resolution = Smallest change an instrument can detect (e.g., 0.1°C in a thermometer).
Summary Table: Measurement Systems
| System Type | Key Feature | Example Instrument |
|---|---|---|
| Analog | Continuous signal output. | Mercury thermometer, analog voltmeter. |
| Digital | Discrete signal output (binary). | Digital multimeter, smart scales. |
| Closed-Loop | Feedback corrects errors automatically. | Thermostat, cruise control. |
| Open-Loop | No feedback; relies on calibration. | Simple pressure gauge. |
Based on the PU BE Computer (PU) syllabus for Instrumentation, unit 1.
Discussion
Loading…