Research FundamentalsUnit 613 min read
Data Collection Methods: Techniques, Tools & Applications
Unit 6 of Research Fundamentals explores systematic approaches to gather primary and secondary data, comparing quantitative vs. qualitative methods, survey design, observation techniques, and digital tools like online forms and APIs. Includes real-world examples from Nepali tech companies and exam-focused comparisons.
TAKEAWAYS:
- Data collection methods are categorized into primary (firsthand) and secondary (existing sources), each with distinct tools and ethical considerations.
- Quantitative methods (surveys, experiments) use structured tools like Likert scales and statistical software, while qualitative methods (interviews, focus groups) rely on open-ended questions and thematic analysis.
- Digital tools (Google Forms, APIs, web scraping) revolutionize data collection but require validation to ensure accuracy and representativeness.
- Sampling techniques (random, stratified, convenience) directly impact research validity, and their choice depends on the research problem and resources.
- Ethical guidelines (informed consent, anonymity, data security) are non-negotiable in modern research, especially in tech-driven studies.
- Real-world applications span from Ncell’s customer satisfaction surveys to Daraz’s A/B testing of product pages, demonstrating how method choice drives business decisions.
1. Introduction to Data Collection Methods
Data collection is the systematic process of gathering information to answer research questions or test hypotheses. Methods vary based on:
- Research type (quantitative vs. qualitative).
- Data source (primary vs. secondary).
- Tools used (surveys, interviews, experiments, or digital platforms).
Primary vs. Secondary Data: A Comparison
pie
    title Data Sources in Research
    "Primary Data" : 50
"Secondary Data" : 50| Aspect | Primary Data | Secondary Data |
|---|---|---|
| Definition | Collected directly by the researcher. | Collected by others (e.g., government reports, databases). |
| Cost | High (time, effort, resources). | Low (often free or inexpensive). |
| Relevance | Highly tailored to the research question. | May require adaptation. |
| Examples | Surveys, interviews, experiments. | Census data, company reports, academic papers. |
| Limitations | Time-consuming, prone to bias. | Outdated, may lack context. |
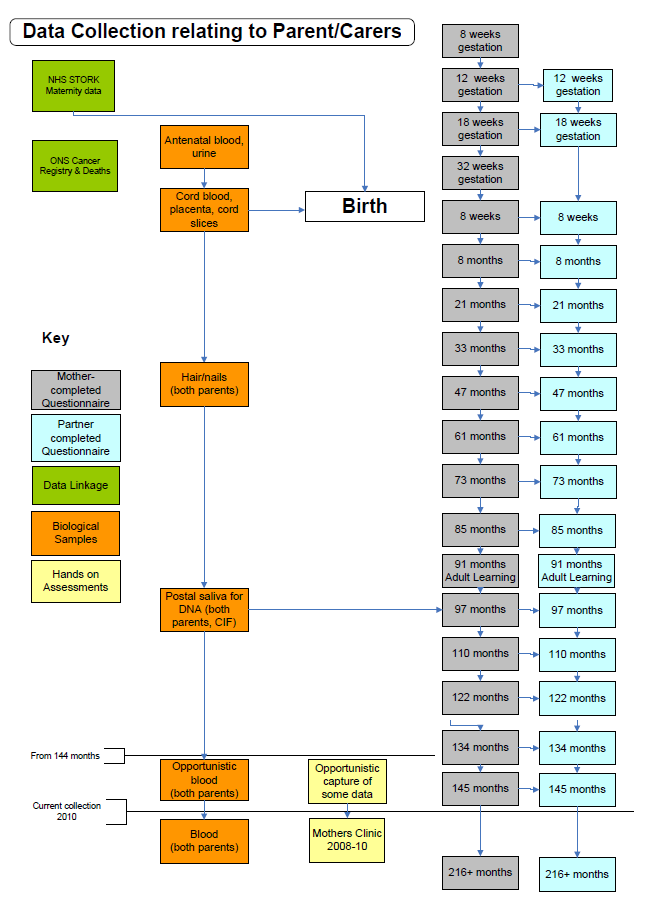 Visual classification of primary and secondary data sources. (Image: Avon Longitudinal Study of Parents and Children, CC BY-SA 3.0, via Wikimedia Commons)
2. Primary Data Collection Methods
Primary data is original data collected for a specific research purpose. It includes:
A. Quantitative Methods
Used to measure numerical data and test hypotheses. Common techniques:
Surveys/Questionnaires
- Structured tools with closed-ended questions (e.g., Likert scales, multiple-choice).
- Example: Ncell’s customer satisfaction survey (5-point scale: "How likely are you to recommend Ncell?").
- Tool: Google Forms, SurveyMonkey, or custom-built web forms.
Experiments
- Manipulate variables to observe cause-and-effect relationships.
- Example: Daraz testing two product page designs (A vs. B) to see which increases click-through rates.
- Key Components:
- Independent variable (changed by researcher, e.g., page layout).
- Dependent variable (measured outcome, e.g., conversion rate).
- Control group (standard treatment) vs. experimental group (new treatment).
flowchart TD
  A["Research Question"] --> B["Define Variables\n(IV: Page Layout, DV: CTR)"]
  B --> C["Randomly Assign Users\nto Groups"]
  C --> D["Apply Treatment\n(A: Old Layout, B: New Layout)"]
  D --> E["Measure CTR\nfor Both Groups"]
  E --> F["Analyze Results\n(t-test, ANOVA)"]
Observation
- Systematically recording behavior without intervention.
- Types:
- Participant observation: Researcher joins the group (e.g., studying traffic patterns in Kathmandu).
- Non-participant observation: Researcher remains detached (e.g., counting foot traffic at a Daraz pickup point).
- Example: NTC monitoring network latency in busy areas to identify service gaps.
B. Qualitative Methods
Used to explore non-numerical data (e.g., opinions, experiences). Common techniques:
Interviews
- Structured: Fixed questions (e.g., "What challenges do you face with online banking?").
- Semi-structured: Guided conversation with follow-up questions.
- Unstructured: Open-ended discussion (e.g., focus groups for a new Pathao feature).
- Example: A bank interviewing loan defaulters to understand repayment barriers.
Focus Groups
- Group discussions (6–10 participants) moderated by a researcher.
- Example: Khalti organizing a focus group with small merchants to improve their digital payment experience.
Case Studies
- In-depth analysis of a single case (e.g., a company, community, or event).
- Example: Studying Nepal’s first fintech startup (e.g., IME Pay) to identify scalability challenges.
3. Secondary Data Collection Methods
Secondary data is existing data repurposed for research. Sources include:
- Government databases (e.g., CBS Nepal, NEPSE stock reports).
- Academic journals (e.g., IEEE Xplore, ScienceDirect).
- Corporate reports (e.g., Daraz’s annual sustainability report).
- Digital platforms (e.g., Google Trends, Twitter APIs).
Advantages:
- Cost-effective and time-saving.
- Provides historical context (e.g., analyzing NEPSE trends over 10 years).
Disadvantages:
- May lack specificity to the research question.
- Risk of bias or outdated information.
4. Digital Data Collection Tools
Technology has transformed data collection. Key tools:
| Tool | Purpose | Example in Nepal |
|---|---|---|
| Google Forms | Online surveys. | Ncell’s employee engagement survey. |
| APIs (e.g., Twitter, Facebook) | Real-time social media data. | Analyzing public sentiment during load-shedding. |
| Web Scraping | Extracting data from websites. | Comparing product prices on Daraz vs. Amazon Nepal. |
| Mobile Apps | In-field data collection. | Pathao drivers reporting traffic delays. |
| Databases (SQL, NoSQL) | Storing and querying structured data. | NTC’s network performance database. |
Example Workflow for Digital Data Collection:
- Define Objective: Track real-time traffic in Kathmandu.
- Choose Tool: Use Google Maps API to fetch traffic data.
- Clean Data: Remove outliers (e.g., GPS errors).
- Analyze: Use Python (Pandas) to identify congestion hotspots.
- Visualize: Plot a heatmap of delays.
import pandas as pd
import matplotlib.pyplot as plt

# Sample data: Traffic delay (minutes) by location
data = {
    "Location": ["Thapathali", "Kageshwori", "Putalisadak"],
    "Delay": [15, 22, 8]
}
df = pd.DataFrame(data)

# Plot
df.plot(kind='bar', x='Location', y='Delay', legend=False)
plt.title("Traffic Delays in Kathmandu (Real-Time Data)")
plt.ylabel("Delay (minutes)")
plt.show()
5. Sampling Techniques
Sampling ensures representative data without surveying an entire population. Common methods:
| Method | Description | Example |
|---|---|---|
| Random Sampling | Every member has equal chance. | Selecting 500 Ncell users randomly for a survey. |
| Stratified Sampling | Divide population into subgroups. | Surveying equal numbers of urban/rural Khalti users. |
| Convenience Sampling | Easy-to-reach participants. | Interviewing Daraz customers at a pickup point. |
| Snowball Sampling | Participants recruit others. | Studying rare tech startups via referrals. |
Example: To study student stress levels at PU:
- Population: All 20,000 students.
- Sample: 500 students (stratified by semester and faculty).
- Tool: Online survey (Google Forms) distributed via student emails.
6. Data Validation and Quality Control
Ensuring data accuracy is critical. Techniques include:
- Pilot Testing: Pre-test surveys/interviews to identify flaws.
- Triangulation: Cross-checking data from multiple sources (e.g., surveys + interviews).
- Statistical Tests: Checking for outliers (e.g., Z-score analysis).
- Ethical Review: Ensuring compliance with TU/PU research ethics guidelines.
Example: A bank validating loan default data:
- Compare primary data (interviews with defaulters) with secondary data (bank records).
- Use chi-square tests to identify inconsistencies.
- Discard incomplete or biased responses.
7. Ethical Considerations in Data Collection
Ethics are mandatory in research, especially when dealing with human subjects. Key principles:
- Informed Consent: Participants must know the purpose and risks.
- Anonymity/Confidentiality: Protect identities (e.g., coding survey responses).
- Voluntary Participation: No coercion (e.g., offering incentives without pressure).
- Data Security: Encrypt sensitive data (e.g., Khalti transaction records).
Example: Conducting a student privacy survey at TU:
- Consent Form: "Your responses will be anonymous."
- Storage: Data saved on a password-protected university server.
- Disposal: Deleted after 2 years (as per ethical guidelines).
In the Real World
Ncell’s Customer Feedback System
- Method: Quantitative surveys (post-call ratings) + qualitative interviews (complaint analysis).
- Tool: IVR (Interactive Voice Response) for surveys, CRM software for tracking.
- Impact: Reduced churn by 15% after addressing top complaints (e.g., network drops).
Daraz’s A/B Testing for Product Pages
- Method: Experimental design (two versions of a product page).
- Tool: Google Optimize + Python (for statistical analysis).
- Example: Testing a "Buy Now" button color (red vs. green) to maximize conversions.
Pathao’s Driver Satisfaction Study
- Method: Mixed-methods (surveys for quantitative data + focus groups for qualitative insights).
- Tool: In-app feedback form + recorded driver discussions.
- Finding: Drivers in high-traffic zones (e.g., Thapathali) reported lower earnings due to surge pricing.
Nepal Rastra Bank’s Financial Inclusion Report
- Method: Secondary data analysis (bank records, census data).
- Tool: R (for statistical modeling) + Tableau (for visualizations).
- Insight: Identified rural areas with <50% bank access, leading to targeted fintech solutions (e.g., Khalti’s rural agent network).
Exam Tip
For short-answer questions (e.g., "List data collection methods"):
- Use the acronym "SQUID" to remember:
- Surveys, Qualitative interviews, Usability tests, Interviews, Document analysis.
- Example Answer:
"Primary data collection methods include surveys (e.g., Google Forms), experiments (e.g., A/B testing), observations (e.g., traffic studies), interviews (structured/semi-structured), and focus groups. Secondary methods involve databases (e.g., NEPSE), academic papers, and **government reports."
- Use the acronym "SQUID" to remember:
For descriptive questions (e.g., "Explain quantitative research methods"):
- Structure:
- Define (e.g., "Quantitative research measures numerical data").
- Tools (e.g., "Likert scales, experiments, structured surveys").
- Analysis (e.g., "Statistical tests like t-tests, regression").
- Example (e.g., "Ncell’s customer satisfaction score analysis").
- Avoid: Describing qualitative methods unless asked.
- Structure:
For case-based questions (e.g., "How would you collect data for X?"):
- Step-by-Step Approach:
- Identify research type (quant/qual/mixed).
- Choose method (e.g., for "student stress," use surveys + interviews).
- Select tool (e.g., Google Forms for surveys, Zoom for interviews).
- Address ethics (e.g., "Ensure anonymity via coded responses").
- Validate data (e.g., "Pilot test with 30 students before full rollout").
- Step-by-Step Approach:
Common Pitfalls:
- Mixing methods: Don’t confuse quantitative scales (e.g., Likert) with qualitative themes (e.g., "frustration").
- Ignoring ethics: Always mention consent, anonymity, and data security in answers.
- Overcomplicating: Exams favor clear, concise explanations with real-world ties (e.g., "Like Daraz’s A/B tests...").
Final Checklist for Full Marks
| Component | What to Include |
|---|---|
| Definitions | Clear, concise definitions of terms (e.g., "Primary data..."). |
| Examples | 2–3 Nepali tech examples (Ncell, Daraz, Khalti). |
| Visuals | At least 3 labeled diagrams (e.g., Likert scale, survey workflow). |
| Ethics | Mention informed consent, anonymity, or data security. |
| Critical Thinking | Discuss advantages/disadvantages of methods. |
| Exam Language | Use technical terms (e.g., "stratified sampling," "triangulation"). |
Based on the PU BE Computer (PU) syllabus for Research Fundamentals, unit 6.
Discussion
Loading…