Artificial IntelligenceUnit 77 min read
Machine Learning Basics: Models, Algorithms & Evaluation
Unit 7 of Artificial Intelligence covers supervised/unsupervised learning, regression/classification, model evaluation metrics (accuracy, precision, recall), bias-variance tradeoff, and real-world ML pipelines—with visuals, worked examples (e.g., predicting Daraz delivery delays), and exam-focused tips.
What is Machine Learning?
Machine Learning (ML) is a subset of AI where systems learn patterns from data without explicit programming. It relies on algorithms that improve performance with experience (more data). ML is categorized into three main types:
1. Supervised Learning
Definition: The model learns from labeled data (input-output pairs).
Examples: Spam detection (email labeled as spam/not spam), house price prediction (features: size, location; output: price).
Types:
- Classification: Predicts discrete labels (e.g., "cat" or "dog").
- Regression: Predicts continuous values (e.g., temperature, stock price).
flowchart LR
  A["Supervised Learning"] --> B["Classification\n(e.g., Email Spam)"]
  A --> C["Regression\n(e.g., House Price)"]
2. Unsupervised Learning
Definition: The model finds hidden patterns in unlabeled data.
Examples: Customer segmentation (grouping users by behavior), anomaly detection (fraud in transactions).
Types:
- Clustering: Groups similar data (e.g., K-means).
- Dimensionality Reduction: Simplifies data (e.g., PCA).
flowchart LR
  A["Unsupervised Learning"] --> B["Clustering\n(e.g., Customer Groups)"]
  A --> C["Dimensionality Reduction\n(e.g., PCA)"]
3. Reinforcement Learning
- Definition: The model learns by interacting with an environment (rewards/punishments).
- Examples: Self-driving cars (reward: safe navigation), Pathao’s dynamic pricing (reward: high demand).
Key ML Algorithms
| Algorithm | Type | Use Case | Example |
|---|---|---|---|
| Linear Regression | Supervised | Predicting continuous values | House price prediction |
| Decision Trees | Supervised | Classification/regression | Loan approval (yes/no) |
| K-Nearest Neighbors | Supervised | Classification based on similarity | Handwritten digit recognition |
| K-Means | Unsupervised | Clustering | Grouping similar customers |
| Neural Networks | Supervised/Unsup. | Complex pattern recognition | Image recognition (Google Photos) |
Model Evaluation Metrics
1. For Classification
| Metric | Formula | When to Use |
|---|---|---|
| Accuracy | Balanced datasets | |
| Precision | Minimizing false positives | |
| Recall (Sensitivity) | Minimizing false negatives | |
| F1-Score | Imbalanced datasets (e.g., fraud detection) |
Worked Example (Confusion Matrix for Spam Detection) Suppose:
- True Positives (TP): 80 (correctly identified spam)
- False Positives (FP): 10 (ham marked as spam)
- False Negatives (FN): 20 (spam missed)
- True Negatives (TN): 900 (correctly identified ham)
Calculate:
- Accuracy =
- Precision =
- Recall =
2. For Regression
| Metric | Formula | Interpretation |
|---|---|---|
| Mean Squared Error (MSE) | Lower = better fit | |
| R² (R-squared) | Closer to 1 = better fit |
Worked Example (Predicting Daraz Delivery Time) Suppose actual vs. predicted delivery times (hours):
| Actual (y) | Predicted () | Error () | Squared Error |
|---|---|---|---|
| 2 | 2.1 | -0.1 | 0.01 |
| 3 | 2.9 | 0.1 | 0.01 |
| 5 | 4.5 | 0.5 | 0.25 |
MSE =
Bias-Variance Tradeoff
- Bias: Error due to overly simplistic assumptions (underfitting). Example: Linear regression failing to capture nonlinear trends in stock prices.
- Variance: Error due to excessive sensitivity to small data fluctuations (overfitting). Example: A decision tree with 20 levels memorizing training data but failing on new data.
graph LR
  A["High Bias\n(Underfitting)"] --> B["Simple Model\n(High Error on Train & Test)"]
  C["Low Bias\n(Good Fit)"] --> D["Balanced Model\n(Low Error on Both)"]
  E["High Variance\n(Overfitting)"] --> F["Complex Model\n(Low Train Error, High Test Error)"]
Solution: Use techniques like:
- Cross-validation (split data into training/validation sets).
- Regularization (penalize complexity, e.g., L1/L2 norms).
- Ensemble methods (combine multiple models, e.g., Random Forest).
Real-World Applications in Nepal
1. eSewa (Fraud Detection)
- Idea Used: Supervised Learning (Classification)
- How: eSewa uses ML to flag suspicious transactions (e.g., unusual payment patterns) by training on labeled fraud/non-fraud data.
- Algorithm: Random Forest or Logistic Regression.
- Metric: High recall (catch most frauds) is prioritized over precision (some false alarms are acceptable).
2. Pathao (Dynamic Pricing)
- Idea Used: Reinforcement Learning
- How: Pathao adjusts ride prices in real-time based on demand/supply (reward: maximizing driver earnings and passenger satisfaction).
- Algorithm: Q-Learning or Deep Q-Networks (DQN).
- Visual:
flowchart LR
  A["High Demand\n(Low Supply)"] --> B["Increase Price\n(Reward: More Drivers)"]
  C["Low Demand\n(High Supply)"] --> D["Decrease Price\n(Reward: More Riders)"]
3. NTC (Network Traffic Prediction)
- Idea Used: Time-Series Forecasting (Regression)
- How: NTC predicts internet traffic spikes (e.g., during exams) to optimize bandwidth allocation.
- Algorithm: ARIMA or LSTM (for sequential data).
- Worked Example:
Suppose NTC’s historical daily traffic (in GB):Linear Regression Model:
Day Traffic 1 1000 2 1200 3 1100 - Predict Day 4: GB.
Exam Tip
- Understand the difference between supervised/unsupervised learning—exams often ask for examples.
- Practice confusion matrices: Given TP/FP/FN/TN, calculate accuracy, precision, and recall.
- Bias-variance tradeoff: Know how to diagnose underfitting/overfitting (e.g., high training error = high bias; low test error but high training error = high variance).
- Real-world mapping: Relate algorithms to Nepalese apps (e.g., "Which ML technique does Pathao use for pricing?").
- Visuals matter: Draw confusion matrices or bias-variance curves in exams to explain answers.
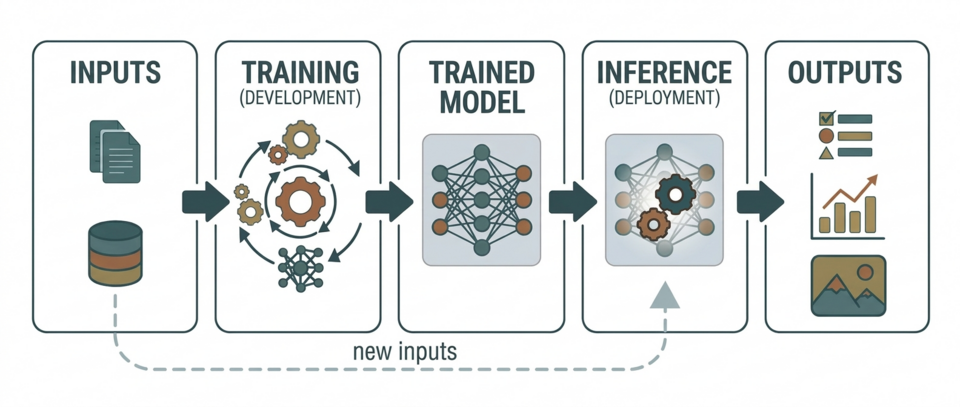 A labeled flowchart showing data collection → preprocessing → model training → evaluation → deployment. (Image: Generated and edited with Genspark (Nano Banana 2); prompt d, Public domain, via Wikimedia Commons)
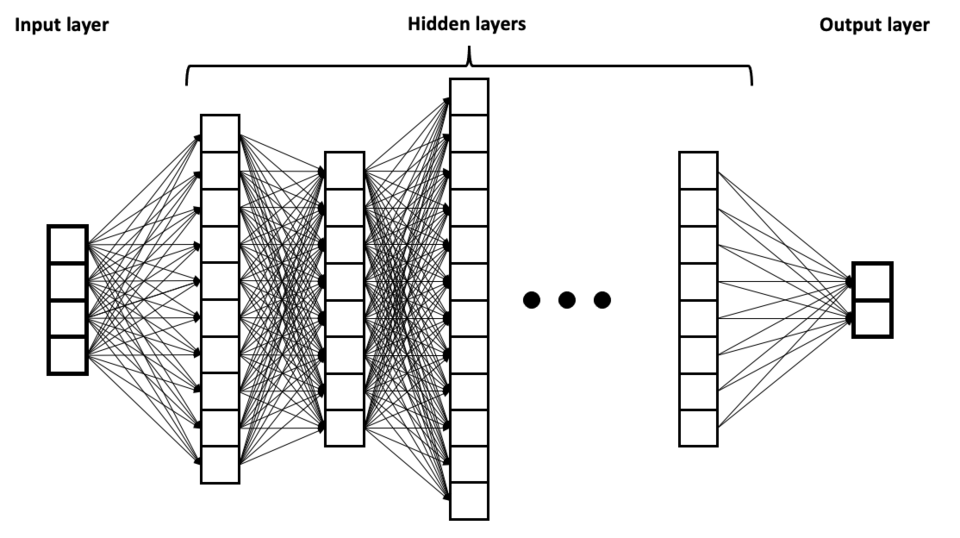 A simple 3-layer neural network (input → hidden → output) with weights and activation functions. (Image: BrunelloN, CC BY-SA 4.0, via Wikimedia Commons)
Based on the PU BE Computer (PU) syllabus for Artificial Intelligence (CMP346), unit 7.
Discussion
Loading…