Engineering EconomicsUnit 99 min read
Break-Even Analysis & Sensitivity: Charts, Risks & Real-World Tradeoffs
Unit 9 of Engineering Economics teaches how to calculate break-even points (fixed costs, variable costs, price per unit), analyze sensitivity of projects to input changes, and use these tools to make smarter financial decisions in engineering projects—with Nepalese case studies like Daraz’s order fulfillment and Ncell’
Core Concepts
1. Break-Even Analysis: The Math Behind "No Profit, No Loss"
Break-even analysis determines the minimum sales volume where Total Revenue (TR) equals Total Cost (TC). At this point, the project neither makes a profit nor incurs a loss.
Key Formulas
- Break-Even Quantity (Q):
- Break-Even Revenue (R):
Worked Example: Daraz’s Order Fulfillment
Daraz, Nepal’s largest e-commerce platform, must decide how many orders it can fulfill before breaking even on its warehouse costs. Assume:
- Fixed Costs (FC): Rs. 500,000 (rent, salaries, security)
- Variable Cost per Order (VC): Rs. 200 (packaging, shipping, handling)
- Selling Price per Order (P): Rs. 500 (after discounts)
Calculation: Daraz must fulfill 1,667 orders to break even. If it sells fewer, it loses money; more, it profits.
2. Sensitivity Analysis: Testing "What If?"
Sensitivity analysis examines how changes in input variables (costs, prices, demand) affect project outcomes. It helps engineers and managers identify critical risk factors.
Steps:
- Identify Key Variables: Costs, revenues, interest rates, demand.
- Vary Each Variable: Change one variable at a time (e.g., +10%, -10%).
- Observe Impact: Does the project remain viable? Does the break-even point shift?
Example: Ncell’s Subscriber Pricing
Ncell wants to test how a 10% price increase affects its break-even subscriber count.
- Original Break-Even: 50,000 subscribers (FC = Rs. 200M, P = Rs. 1,000, VC = Rs. 600).
- New Price (P): Rs. 1,100 (10% increase).
- New Break-Even (Q): A 10% price hike reduces break-even subscribers by 20%, making the business more resilient to lower demand.
3. Break-Even Chart: Visualizing Profit Zones
A Break-Even Chart plots:
- Total Revenue (TR): Straight line from origin (slope = price per unit).
- Total Cost (TC): Fixed cost (y-intercept) + variable cost (slope = VC per unit).
- Break-Even Point: Where TR and TC intersect.
Key Observations:
- Above Break-Even: Profit increases with each additional unit sold.
- Below Break-Even: Losses grow as fixed costs remain unchanged.
- Margin of Safety: Distance from current sales to break-even point.
4. Types of Break-Even Analysis
| Type | Description | Example |
|---|---|---|
| Unit Break-Even | Calculates the number of units to sell to break even. | Daraz’s order fulfillment (1,667 orders). |
| Dollar Break-Even | Calculates the revenue needed to break even. | Ncell’s Rs. 50M in subscriber fees. |
| Time Break-Even | Determines how long it takes to recover initial investment. | A solar panel project recouping costs in 3 years. |
| Multi-Product Break-Even | Accounts for different products with varying costs and prices. | A factory producing both laptops and smartphones. |
5. Sensitivity Analysis in Action: Kathmandu Traffic Routes
The Kathmandu Metropolitan City is analyzing traffic congestion on Ring Road vs. Bhaktapur Road. They want to know:
- How does a 10% increase in fuel prices affect break-even traffic volume?
- What if public transport usage drops by 20%?
Assumptions:
- Fixed Costs (FC): Rs. 50M (road maintenance, signals).
- Variable Cost per Vehicle (VC): Rs. 200 (wear and tear, emissions).
- Revenue per Vehicle (P): Rs. 500 (toll fees + indirect benefits).
Original Break-Even:
Scenario 1: 10% Fuel Price Increase → VC rises to Rs. 220 Impact: Break-even increases by 11%, meaning more traffic is needed to cover costs.
Scenario 2: 20% Drop in Public Transport → Demand drops by 15% New demand = 85% of original. If original demand was 200,000 vehicles/day, new demand = 170,000. But break-even is 166,667, so the road is barely profitable.
flowchart TD
    A["Original Break-Even: 166,667 vehicles"] --> B["10% Fuel Hike"]
    B --> C["New Break-Even: 185,185 vehicles"]
    A --> D["20% Less Public Transport"]
    D --> E["New Demand: 170,000 vehicles"]
    E --> F["Profit Margin: Rs. 1.67M/day"]
    F --> G["Risk: Small demand drop → Losses"]
In the Real World
eSewa & Khalti (Digital Payments)
- Break-Even Idea: Both apps calculate the minimum number of transactions needed to cover server costs, developer salaries, and fraud prevention.
- Example: If Khalti’s fixed costs are Rs. 200M/year and each transaction costs Rs. 5 to process, it needs 40M transactions/year to break even at Rs. 5/transaction fee.
- Sensitivity: A 1% drop in user base increases break-even transactions to 40.4M, making the business vulnerable to competition.
Daraz (E-Commerce Logistics)
- Break-Even Idea: Daraz’s warehouse must fulfill enough orders to cover rent, staff, and last-mile delivery costs.
- Example: If Daraz’s fixed costs are Rs. 800M/year and variable cost per order is Rs. 300, it needs 2.67M orders/year to break even at Rs. 500/order.
- Sensitivity: A 5% price war (orders drop by 10%) raises break-even to 2.97M orders, forcing Daraz to cut costs or raise prices.
Nepal Electricity Authority (NEA) & NTC
- Break-Even Idea: NTC’s electricity distribution must recover generation, transmission, and subsidy costs.
- Example: If NTC’s fixed costs are Rs. 10B/year and variable cost per unit is Rs. 5, it needs to sell 20B units/year to break even at Rs. 10/unit.
- Sensitivity: A 10% increase in fuel costs (VC rises to Rs. 5.5) raises break-even to 22.2B units, risking losses if demand stagnates.
Exam Tip
Always Draw the Break-Even Chart
- Examiners love visuals. Label FC, VC, TR, break-even point, and profit/loss zones.
- Example: In a question about a solar panel project, sketch:
- FC: Land lease, installation.
- VC: Maintenance, panel replacement.
- TR: Electricity savings over time.
Show Sensitivity Analysis Tables
- For every break-even question, vary 2 variables (e.g., price and demand) and show how the break-even point shifts.
- Example:
Scenario Price (Rs.) Demand (Units) Break-Even (Units) Base Case 1,000 50,000 25,000 +10% Price 1,100 50,000 20,000 -10% Demand 1,000 45,000 27,778
Real-World Applications Are Your Friend
- Tie answers to Nepalese companies (Daraz, Ncell, NTC) or everyday scenarios (traffic, fuel prices).
- Example: "Like Daraz, a local bakery must sell X loaves to cover flour, rent, and labor costs. If wheat prices rise by 15%, the break-even loaves increase by Y%."
Watch for Hidden Assumptions
- Questions often omit taxes, inflation, or opportunity costs. State them explicitly: "Assuming no inflation and a 15% corporate tax, the after-tax break-even point is..."
Common Pitfalls
- Miscounting Fixed vs. Variable Costs: Always double-check which costs are fixed (e.g., machinery lease) and which vary (e.g., raw materials).
- Ignoring Time Value: If the question involves multiple years, use present worth analysis to adjust break-even quantities.
- Overlooking Sensitivity: Even if a project breaks even, a small change in demand might make it unprofitable. Always analyze sensitivity.
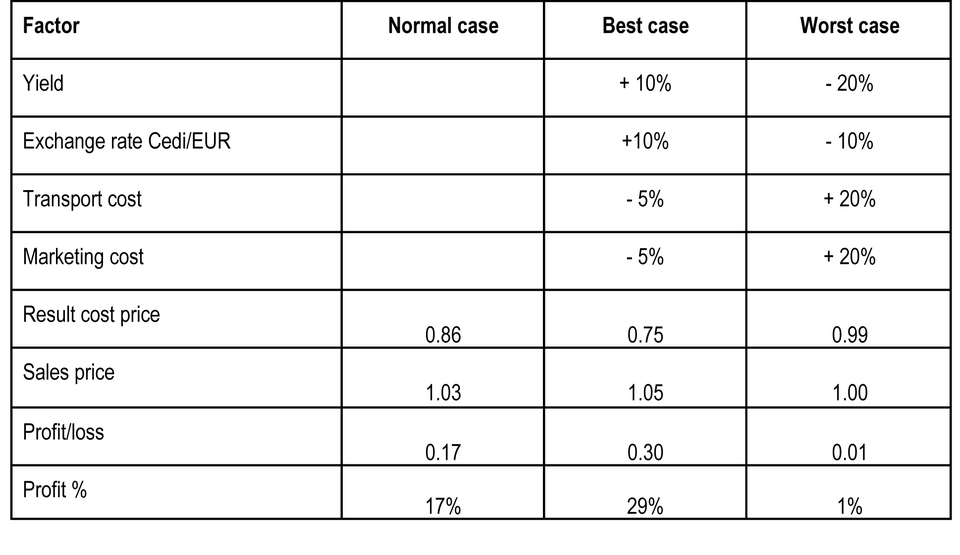 A table showing how changes in price and demand affect break-even quantities. (Image: Oftcc, CC BY-SA 3.0, via Wikimedia Commons)
Based on the PU BE Computer (PU) syllabus for Engineering Economics (MGT250), unit 9.
Discussion
Loading…