Cost and Management AccountingUnit 410 min read
Cost Allocation & Apportionment: Methods, Bases & Real-World Applications
Unit 4 of Cost and Management Accounting covers how indirect costs are distributed between products/services using allocation (arbitrary) and apportionment (logical) methods, with real-world examples from Nepali businesses like NTC and Daraz, plus step-by-step calculations for exam scenarios.
Core Concepts
1. Definitions: Allocation vs. Apportionment
graph LR
    A["Indirect Costs"] --> B["Allocation"]
    A --> C["Apportionment"]
    B --> D["Arbitrary Basis\n(e.g., 50:50 split)"]
C --> E["Logical Basis\n(e.g., floor area, machine hours)"]- Allocation: Splitting costs subjectively (e.g., 60% to Product A, 40% to Product B) when no direct link exists.
- Apportionment: Distributing costs objectively using a cause-and-effect relationship (e.g., electricity bills by machine hours).
- Key Difference:
Allocation Apportionment No direct link to cost driver Direct link to cost driver Example: Rent split 50:50 Example: Water bill by liters used
2. Why It Matters: The "Nepali Daraz" Example
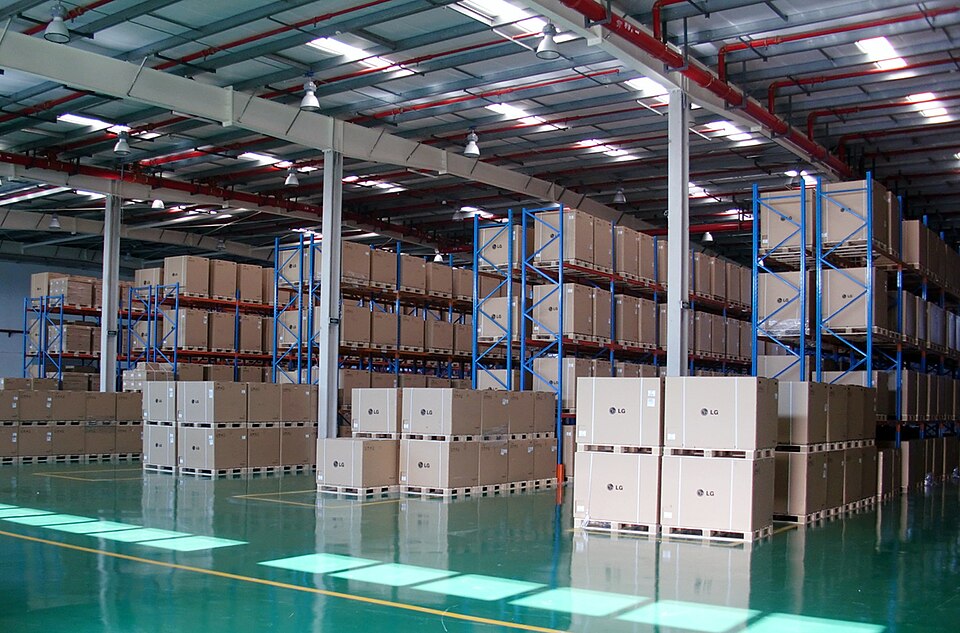 Daraz’s Kathmandu fulfillment center where indirect costs (rent, salaries) must be split between thousands of orders. (Image: Romlogistics, CC BY-SA 3.0, via Wikimedia Commons)
Scenario: Daraz Nepal operates from a single warehouse in Kathmandu. Monthly costs:
- Rent: Rs. 500,000
- Salaries (warehouse staff): Rs. 300,000
- Electricity: Rs. 100,000
Problem: How to assign these costs to Product A (Electronics) and Product B (Groceries)?
- Allocation: Split rent 60:40 (arbitrary).
- Apportionment: Use floor space occupied (Electronics: 600 sq.m; Groceries: 400 sq.m).
Calculation:
Rent Allocation:
- Electronics: (600/1000) × 500,000 = Rs. 300,000
- Groceries: (400/1000) × 500,000 = Rs. 200,000
Why This Matters:
- Daraz uses apportionment to price products accurately (e.g., electronics may have higher "hidden" costs due to space).
- Exam Tip: Always ask "Is there a logical basis?" before choosing allocation/apportionment.
3. Step-by-Step: Allocating Costs to Departments
Step 1: Identify Indirect Costs
Example: A Kathmandu-based textile factory (e.g., Siddhartha Group) has:
- Factory Overhead: Rs. 2,000,000
- Rent: Rs. 500,000
- Depreciation: Rs. 300,000
- Supervisor Salaries: Rs. 1,200,000
- Departments:
- Cutting (5 machines, 2 supervisors)
- Sewing (10 machines, 3 supervisors)
- Finishing (3 machines, 1 supervisor)
Step 2: Choose Allocation Bases
| Cost | Allocation Base | Reason |
|---|---|---|
| Rent | Floor Area (sq.m) | Rent depends on space used. |
| Depreciation | Machine Hours | Machines wear out over time. |
| Supervisor Salaries | Number of Supervisors | Salaries are per employee. |
Step 3: Calculate Allocation Rates
Rent:
- Total floor area: 500 sq.m (Cutting: 100; Sewing: 300; Finishing: 100).
- Rate = Rs. 500,000 / 500 = Rs. 1,000/sq.m.
- Cutting: 100 × 1,000 = Rs. 100,000.
Depreciation:
- Total machine hours: 20,000 (Cutting: 5,000; Sewing: 12,000; Finishing: 3,000).
- Rate = Rs. 300,000 / 20,000 = Rs. 15/hour.
- Cutting: 5,000 × 15 = Rs. 75,000.
Supervisor Salaries:
- Total salaries: Rs. 1,200,000.
- Rate = Rs. 1,200,000 / 6 = Rs. 200,000/supervisor.
- Cutting: 2 × 200,000 = Rs. 400,000.
Step 4: Prepare Allocation Table
| Department | Rent | Depreciation | Salaries | Total Allocated |
|---|---|---|---|---|
| Cutting | Rs. 100,000 | Rs. 75,000 | Rs. 400,000 | Rs. 575,000 |
| Sewing | Rs. 300,000 | Rs. 180,000 | Rs. 600,000 | Rs. 1,080,000 |
| Finishing | Rs. 100,000 | Rs. 45,000 | Rs. 200,000 | Rs. 345,000 |
| Total | Rs. 500,000 | Rs. 300,000 | Rs. 1,200,000 | Rs. 2,000,000 |
Verification: Totals match the original Rs. 2,000,000.
4. Real-World Applications
Example 1: NTC’s Cost Apportionment
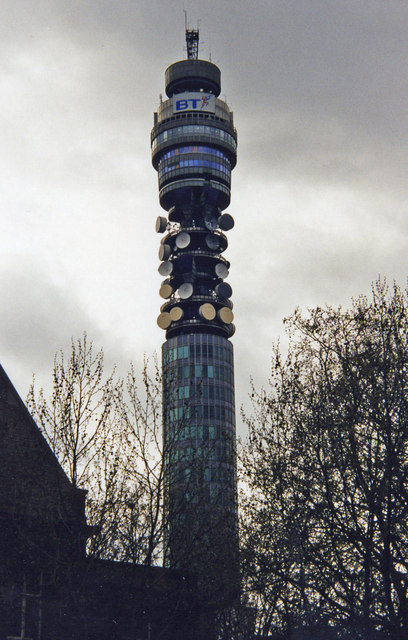 NTC’s transmission towers share costs between voice, internet, and TV services. (Image: wfmillar, CC BY-SA 2.0, via Wikimedia Commons)
Scenario: NTC allocates maintenance costs (Rs. 50,000,000) to:
- Voice Calls: 60% usage
- Internet: 30% usage
- TV Services: 10% usage
Calculation:
Voice: 60% × 50,000,000 = Rs. 30,000,000
Internet: 30% × 50,000,000 = Rs. 15,000,000
TV: 10% × 50,000,000 = Rs. 5,000,000
Why? Ensures fair pricing for each service.
Example 2: Khalti’s Transaction Fees
Scenario: Khalti’s server costs (Rs. 20,000,000) are split between:
- Retailers: 70% of transactions
- Service Providers (e.g., Ncell): 20%
- Government Payments: 10%
Calculation:
Retailers: 70% × 20,000,000 = Rs. 14,000,000
Service Providers: 20% × 20,000,000 = Rs. 4,000,000
Government: 10% × 20,000,000 = Rs. 2,000,000
Impact: Retailers pay slightly higher fees to cover their share of infrastructure costs.
5. Common Allocation Bases
| Cost Type | Possible Bases | Example |
|---|---|---|
| Rent | Floor Area, Number of Employees | Daraz warehouse: sq.m per product |
| Depreciation | Machine Hours, Units Produced | Siddhartha Group: sewing machines |
| Supervisor Salaries | Number of Supervisors, Departments | Kathmandu factory: per department |
| Electricity | Kilowatt-Hours (kWh) | NTC: data centers |
| Insurance | Value of Assets Insured | Bank: vault vs. ATMs |
6. Worked Example: NEPSE’s Cost Allocation
Scenario: NEPSE (Nepal Stock Exchange) allocates IT infrastructure costs (Rs. 10,000,000) to:
- Trading Platform (uses 60% of servers)
- Clearing House (uses 30% of servers)
- Customer Support (uses 10% of servers)
Step 1: Identify the base → Server Usage (%). Step 2: Allocate:
Trading Platform: 60% × 10,000,000 = Rs. 6,000,000
Clearing House: 30% × 10,000,000 = Rs. 3,000,000
Customer Support: 10% × 10,000,000 = Rs. 1,000,000
Exam Tip: Always justify your base (e.g., "Server usage is directly linked to IT costs").
7. Common Mistakes to Avoid
Ignoring the Cause-and-Effect Principle:
- ❌ Allocating rent by number of employees (wrong).
- ✅ Allocating rent by floor area (correct).
Using the Wrong Base:
- ❌ Allocating supervisor salaries by machine hours.
- ✅ Allocating by number of supervisors.
Forgetting to Verify Totals:
- Always check: Sum of allocated costs = Original total cost.
8. Exam Tip: How to Score Full Marks
Step-by-Step Answer Structure
- Define the terms (allocation vs. apportionment).
- Identify the cost to be allocated.
- Choose the base and justify it.
- Calculate the allocation rate.
- Prepare a table with clear headings (Department/Product vs. Cost Type).
- Verify totals.
- Interpret the results (e.g., "This shows Product A bears higher costs due to...").
Sample Exam Question
Question: A company has two departments, A and B, with the following data:
- Rent: Rs. 240,000 (A occupies 60% space, B occupies 40%).
- Depreciation: Rs. 180,000 (A uses 4 machines, B uses 6 machines). Allocate the costs.
Answer:
Rent Allocation:
- Base: Floor Area (%).
- Rate: Rs. 240,000 / 100% = Rs. 2,400/sq.m.
- A: 60% × 240,000 = Rs. 144,000
- B: 40% × 240,000 = Rs. 96,000
Depreciation Allocation:
- Base: Number of Machines.
- Rate: Rs. 180,000 / 10 machines = Rs. 18,000/machine.
- A: 4 × 18,000 = Rs. 72,000
- B: 6 × 18,000 = Rs. 108,000
Table:
Department Rent Depreciation Total Allocated A 144,000 72,000 216,000
| B | 96,000 | 108,000 | 204,000 | | Total | 240,000 | 180,000 | 420,000 |
Marking Scheme
| Criteria | Marks |
|---|---|
| Correct definitions | 2 |
| Appropriate base selection | 3 |
| Accurate calculations | 4 |
| Proper table format | 3 |
| Verification of totals | 2 |
| Total | 14 |
9. Quick Revision Table
| Concept | Key Points | Example |
|---|---|---|
| Allocation | Arbitrary split when no direct link exists. | Rent split 50:50 between two products. |
| Apportionment | Logical split using a cost driver. | Electricity by machine hours. |
| Common Bases | Floor area, machine hours, number of employees, kWh, units produced. | NTC: kWh for data centers. |
| Steps to Allocate | 1. Identify cost. 2. Choose base. 3. Calculate rate. 4. Allocate. 5. Verify. | Daraz: floor space for rent. |
| Real-World Use | Pricing, profitability analysis, budgeting. | Khalti: transaction fees. |
10. Practice Questions
Ncell’s Cost Allocation: Ncell allocates network maintenance costs (Rs. 80,000,000) based on:
- Voice: 50% usage
- Data: 30% usage
- SMS: 20% usage Allocate the costs.
Pathao’s Driver Costs: Pathao has two driver categories:
- Premium Drivers: 30% of fleet, handle 70% of rides.
- Standard Drivers: 70% of fleet, handle 30% of rides. Allocate insurance costs (Rs. 5,000,000) using:
- Option 1: Number of drivers (allocation).
- Option 2: Number of rides (apportionment). Compare both methods.
Final Note: Master this unit by practicing with real-world examples (Nepali businesses like NTC, Daraz, or banks). Always justify your allocation base in exams!
Based on the TU BBS syllabus for Cost and Management Accounting (MGT212), unit 4.
Discussion
Loading…