Cost and Management AccountingUnit 316 min read
Cost-Volume-Profit Analysis: Break-Even, Margin & Decision Making
Unit 3 of Cost and Management Accounting explains how businesses determine profit relationships between costs, sales volume, and pricing using CVP analysis, break-even points, margin of safety, and key decision tools—with real-world Nepali examples like Daraz’s pricing and Ncell’s subscription models.
TAKEAWAYS
- CVP analysis links sales volume, costs, and profit using the formula: Profit = (P × Q) – (FC + VC × Q), where P = price, Q = quantity, FC = fixed costs, VC = variable cost per unit.
- The break-even point (BEP) is where total revenue = total costs (profit = 0), calculated in units or rupees.
- Margin of safety (MoS) shows how much sales can drop before losses occur: MoS = Actual Sales – Break-Even Sales.
- Contribution margin (CM) per unit = Selling Price – Variable Cost, and CM ratio = (CM / Selling Price) × 100% helps assess profitability.
- Assumptions (linear cost-volume relationship, constant price/mix) simplify analysis but must be checked in real scenarios.
- Applications include pricing decisions (e.g., Daraz discounts), capacity planning (e.g., NTC’s bus routes), and cost control (e.g., Kathmandu shops’ inventory).
1. Core Concepts: Definitions and Relationships
Cost-Volume-Profit (CVP) analysis is a planning tool that examines how changes in costs, volume, and prices affect a company’s profit. It helps managers:
- Set selling prices.
- Determine production levels.
- Assess profitability under different scenarios.
Key Terms
| Term | Definition | Formula/Example |
|---|---|---|
| Fixed Costs (FC) | Costs that do not change with production (e.g., rent, salaries). | Rs. 50,000/month for a Kathmandu shop’s lease. |
| Variable Costs (VC) | Costs that vary directly with production (e.g., raw materials, labor per unit). | Rs. 200 per unit for a Daraz seller’s product. |
| Total Cost (TC) | Sum of fixed and variable costs: TC = FC + (VC × Q). | At 1,000 units: Rs. 50,000 + (Rs. 200 × 1,000) = Rs. 250,000. |
| Selling Price (P) | Price per unit charged to customers. | Rs. 500 per unit for a Pathao ride. |
| Total Revenue (TR) | TR = P × Q (sales volume). | At 1,000 units: Rs. 500 × 1,000 = Rs. 500,000. |
| Profit/Loss | Profit = TR – TC or (P – VC) × Q – FC. | Rs. 500,000 – Rs. 250,000 = Rs. 250,000 profit. |
| Contribution Margin (CM) | CM = P – VC (amount left after covering variable costs to pay fixed costs). | Rs. 500 – Rs. 200 = Rs. 300 per unit. |
| Contribution Margin Ratio (CMR) | CMR = (CM / P) × 100%. Used to estimate profit changes. | (Rs. 300 / Rs. 500) × 100% = 60%. |
| Break-Even Point (BEP) | Volume where TR = TC (profit = 0). | In units: BEP = FC / CM; in rupees: BEP = FC / CMR. |
2. How CVP Analysis Works: The Math Behind It
Step 1: Identify Cost Behavior
Classify costs as fixed or variable for a given business. For example:
- Nepal Telecom (NTC):
- Fixed Costs: Salaries of call center staff (Rs. 20 million/month), rent for offices.
- Variable Costs: Cost per minute of call (Rs. 0.50), SMS charges (Rs. 0.10).
Step 2: Calculate Contribution Margin
For a Kathmandu-based retail shop selling handmade carpets:
- Selling Price (P): Rs. 10,000 per carpet.
- Variable Cost (VC): Rs. 4,000 (materials + labor per carpet).
- Contribution Margin (CM): Rs. 10,000 – Rs. 4,000 = Rs. 6,000 per unit.
Step 3: Determine Break-Even Point
Formula:
- BEP (units) = Fixed Costs / Contribution Margin per Unit
- BEP (rupees) = Fixed Costs / Contribution Margin Ratio
Example for the Carpet Shop:
- Fixed Costs (FC): Rs. 120,000/month (rent, salaries).
- CM per unit: Rs. 6,000.
- BEP (units): Rs. 120,000 / Rs. 6,000 = 20 carpets/month.
- BEP (rupees): Rs. 120,000 / (6,000 / 10,000) = Rs. 200,000 in sales.
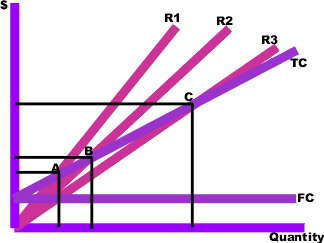 A graph showing total revenue (TR) and total cost (TC) lines intersecting at the break-even point, with profit area above and loss area below. (Image: Mydogategodshat at English Wikipedia, Public domain, via Wikimedia Commons)
Step 4: Calculate Margin of Safety (MoS)
Measures how much sales can drop before the business hits break-even. Formula: MoS = Actual Sales – Break-Even Sales (in units or rupees).
Example:
- Actual Sales: 30 carpets/month (Rs. 300,000).
- BEP: 20 carpets (Rs. 200,000).
- MoS: 30 – 20 = 10 carpets or Rs. 100,000. → The shop can sell 10 fewer carpets before losing money.
3. Real-World Applications in Nepal
Example 1: Daraz’s Discount Strategy
- Scenario: Daraz offers seasonal discounts (e.g., 20% off) to boost sales.
- CVP Application:
- Fixed Costs: Rs. 50 million (warehouse, salaries).
- Variable Cost: Rs. 1,000 per order.
- Original Price: Rs. 5,000; Discounted Price: Rs. 4,000.
- Original CM: Rs. 5,000 – Rs. 1,000 = Rs. 4,000.
- Discounted CM: Rs. 4,000 – Rs. 1,000 = Rs. 3,000.
- New BEP: Rs. 50,000,000 / Rs. 3,000 = 16,667 orders (vs. original 12,500).
- Result: Daraz must sell 3,167 more orders to break even, but higher volume may offset lower CM.
Example 2: Ncell’s Prepaid vs. Postpaid Plans
- Prepaid Plan:
- Fixed Cost: Rs. 0 (no contract).
- Variable Cost: Rs. 100 for Rs. 1,000 talk time.
- Selling Price: Rs. 1,100.
- CM: Rs. 100; BEP: 0 units (since no fixed costs).
- Postpaid Plan:
- Fixed Cost: Rs. 5,000 (customer service, billing).
- Variable Cost: Rs. 50 for Rs. 1,000 talk time.
- Selling Price: Rs. 1,050.
- CM: Rs. 1,000; BEP: Rs. 5,000 / Rs. 1,000 = 5 customers.
- Insight: Ncell needs 5 postpaid users to cover fixed costs, but prepaid has no BEP (ideal for low-income users).
Example 3: Kathmandu Traffic Routes (Public Transport)
- Scenario: A public bus route in Kathmandu has:
- Fixed Costs: Rs. 200,000 (bus lease, driver salary).
- Variable Cost: Rs. 5 per passenger (fuel, maintenance).
- Ticket Price: Rs. 20.
- CM per passenger: Rs. 15.
- BEP: Rs. 200,000 / Rs. 15 = 13,333 passengers/month.
- Current Ridership: 20,000 passengers.
- MoS: 20,000 – 13,333 = 6,667 passengers.
- Decision: If ridership drops below 13,333, the route may need subsidies or fare adjustments.
4. Worked Example: A Nepali Manufacturing Company
Scenario: Himalaya Textiles Ltd. produces woolen blankets. Data for 2023:
- Fixed Costs: Rs. 800,000 (factory rent, salaries).
- Variable Cost per Blanket: Rs. 1,200 (materials, labor).
- Selling Price: Rs. 3,000.
- Actual Production/Sales: 500 blankets.
Step 1: Calculate Contribution Margin
- CM per unit: Rs. 3,000 – Rs. 1,200 = Rs. 1,800.
- Total CM: Rs. 1,800 × 500 = Rs. 900,000.
Step 2: Determine Profit
- Profit = Total CM – Fixed Costs = Rs. 900,000 – Rs. 800,000 = Rs. 100,000.
Step 3: Find Break-Even Point
- BEP (units): Rs. 800,000 / Rs. 1,800 ≈ 444 blankets.
- BEP (rupees): Rs. 800,000 / (1,800 / 3,000) = Rs. 1,333,333.
Step 4: Margin of Safety
- MoS (units): 500 – 444 = 56 blankets.
- MoS (rupees): (500 × Rs. 3,000) – (444 × Rs. 3,000) = Rs. 168,000.
Step 5: What-If Analysis
Question: If the company wants a target profit of Rs. 200,000, how many blankets must it sell? Solution:
- Required CM = Fixed Costs + Target Profit = Rs. 800,000 + Rs. 200,000 = Rs. 1,000,000.
- Units to Sell = Required CM / CM per unit = Rs. 1,000,000 / Rs. 1,800 ≈ 556 blankets.
5. Assumptions and Limitations
CVP analysis relies on simplifying assumptions, which may not hold in reality:
| Assumption | Reality Check | Example in Nepal |
|---|---|---|
| Linear cost-volume relationship | Costs may not change proportionally (e.g., bulk discounts). | A Daraz seller gets a 10% discount for ordering 1,000 units. |
| Constant selling price | Competitors may change prices (e.g., Ncell vs. NTC). | Price wars during festival seasons. |
| Constant mix of products | Companies sell multiple products with different CMs. | A shop selling both carpets and jewelry. |
| No inventory changes | Unsold inventory affects cash flow. | Kathmandu shops with unsold winter clothes in summer. |
| Fixed costs remain constant | Some fixed costs may change (e.g., hiring more staff). | NTC adding more call centers during peak season. |
6. Advantages and Disadvantages
Advantages
- Simple and quick: Uses basic algebra for decision-making.
- Focuses on key drivers: Highlights how volume and price impact profit.
- Helps in pricing: Guides setting minimum prices to cover costs.
- Budgeting tool: Used in sales forecasting and cost control.
Disadvantages
- Ignores inventory: Assumes all units produced are sold (not true for seasonal items).
- Overlooks competition: Prices may be set by market, not just internal costs.
- Fixed costs may vary: Some "fixed" costs (e.g., overtime) can change.
- Short-term focus: May not account for long-term trends (e.g., technology changes).
7. CVP Analysis in Decision Making
Decision 1: Pricing Strategy
- Example: A Kathmandu hotel wants to set room rates.
- Variable Cost per room: Rs. 1,000 (cleaning, utilities).
- Fixed Costs: Rs. 5,000,000 (salaries, mortgage).
- Desired Profit: Rs. 2,000,000.
- Required CM: Rs. 5,000,000 + Rs. 2,000,000 = Rs. 7,000,000.
- CM per room: If selling at Rs. 5,000, CM = Rs. 4,000.
- Rooms to sell: Rs. 7,000,000 / Rs. 4,000 = 1,750 rooms/year.
- Decision: If the hotel has 30 rooms, it needs ~59 bookings/month to meet the target.
Decision 2: Make vs. Buy
- Example: A biscuit factory in Chitwan can either:
- Make packaging boxes:
- Fixed Cost: Rs. 200,000 (machine lease).
- Variable Cost: Rs. 5 per box.
- Total Cost for 50,000 boxes: Rs. 200,000 + (Rs. 5 × 50,000) = Rs. 450,000.
- Buy from a supplier:
- Cost: Rs. 10 per box → Rs. 500,000 for 50,000 boxes.
- Analysis:
- BEP for making: Rs. 200,000 / (Rs. 10 – Rs. 5) = 40,000 boxes.
- Decision: If the factory needs >40,000 boxes, it should make them; otherwise, buy.
- Make packaging boxes:
Decision 3: Product Mix
- Example: A Daraz seller sells two products:
- Product X: Selling Price = Rs. 2,000; VC = Rs. 1,200; CM = Rs. 800.
- Product Y: Selling Price = Rs. 3,000; VC = Rs. 2,500; CM = Rs. 500.
- Constraint: Only 1,000 units of machine time available (X needs 2 hours/unit, Y needs 1 hour).
- Goal: Maximize profit.
- Solution:
- CM per hour:
- X: Rs. 800 / 2 = Rs. 400/hour.
- Y: Rs. 500 / 1 = Rs. 500/hour.
- Decision: Prioritize Product Y (higher CM per hour).
- CM per hour:
8. Graphical Representation: CVP Analysis
graph TD
    A["Sales Volume (Units)"] --> B["Total Revenue (TR) Line: Upward Slope"]
    A --> C["Total Cost (TC) Line: Fixed Cost + Variable Cost"]
    C --> C1["Fixed Cost: Horizontal Line"]
    C --> C2["Variable Cost: Upward Slope from Origin"]
    B --> D["Profit Area: Above TC Line"]
    C --> E["Loss Area: Below TC Line"]
    B & C --> F["Break-Even Point (BEP): Where TR = TC"]
F --> G["Margin of Safety: Distance from Actual Sales to BEP"]Interpretation:
- Area above the TC line: Profit.
- Area below the TC line: Loss.
- BEP: The point where the TR and TC lines intersect.
- Steeper TR line: Higher selling price or lower variable costs.
9. Exam Tip: How to Score Full Marks
Common Mistakes to Avoid
- Ignoring units: Always specify whether BEP is in units or rupees.
- ❌ "BEP is 1,000."
- ✅ "BEP is 1,000 units (or Rs. 500,000)."
- Mixing fixed and variable costs: Clearly label costs as FC or VC.
- Forgetting to calculate MoS: Examiners often ask for it separately.
- Assuming all costs are variable/fixed: Classify costs correctly (e.g., salaries are usually fixed; raw materials are variable).
- Skipping assumptions: Always state 3–4 assumptions in your answer (e.g., "We assume selling price remains constant").
Step-by-Step Answer Format for Exam Questions
Question: "A company has fixed costs of Rs. 200,000, variable cost per unit of Rs. 50, and sells at Rs. 100 per unit. Calculate (a) BEP in units, (b) profit at 5,000 units, (c) MoS if actual sales are 6,000 units."
Model Answer:
Identify Given Data:
- FC = Rs. 200,000
- VC = Rs. 50/unit
- P = Rs. 100/unit
- Actual Sales = 6,000 units
Calculate Contribution Margin (CM):
- CM per unit = P – VC = Rs. 100 – Rs. 50 = Rs. 50.
(a) Break-Even Point (BEP):
- BEP (units) = FC / CM per unit = Rs. 200,000 / Rs. 50 = 4,000 units.
- BEP (rupees) = 4,000 × Rs. 100 = Rs. 400,000.
(b) Profit at 5,000 Units:
- Total Revenue = 5,000 × Rs. 100 = Rs. 500,000.
- Total Variable Cost = 5,000 × Rs. 50 = Rs. 250,000.
- Total Cost = FC + TVC = Rs. 200,000 + Rs. 250,000 = Rs. 450,000.
- Profit = TR – TC = Rs. 500,000 – Rs. 450,000 = Rs. 50,000.
(c) Margin of Safety (MoS):
- MoS (units) = Actual Sales – BEP = 6,000 – 4,000 = 2,000 units.
- MoS (rupees) = 2,000 × Rs. 100 = Rs. 200,000.
Assumptions:
- Selling price and variable cost per unit remain constant.
- All units produced are sold.
- Fixed costs do not change with production volume.
10. Practice Questions for TU Exams
Short Answer:
- Define contribution margin ratio and explain its importance in CVP analysis.
Numerical:
- A company has fixed costs of Rs. 150,000 and variable costs of Rs. 30 per unit. It sells at Rs. 50 per unit.
- Calculate BEP in units and rupees.
- Determine the profit if 10,000 units are sold.
- Find the MoS if actual sales are 12,000 units.
- A company has fixed costs of Rs. 150,000 and variable costs of Rs. 30 per unit. It sells at Rs. 50 per unit.
Scenario-Based:
- Nepal Airlines has two routes:
- Route A: FC = Rs. 5,000,000; VC = Rs. 2,000 per passenger; Price = Rs. 5,000.
- Route B: FC = Rs. 3,000,000; VC = Rs. 1,500 per passenger; Price = Rs. 4,000.
- Which route has a lower BEP? Why?
- Nepal Airlines has two routes:
Decision Making:
- A biscuit manufacturer can either:
- Make packaging: FC = Rs. 100,000; VC = Rs. 2/box.
- Buy packaging: Rs. 5/box.
- At what production level should the company switch from buying to making?
- A biscuit manufacturer can either:
11. Summary Table: Key Formulas
| Concept | Formula | Example Calculation |
|---|---|---|
| Contribution Margin | CM = P – VC | Rs. 100 – Rs. 50 = Rs. 50 |
| BEP (Units) | BEP = FC / CM | Rs. 200,000 / Rs. 50 = 4,000 units |
| BEP (Rupees) | BEP = FC / (CM / P) | Rs. 200,000 / (50/100) = Rs. 400,000 |
| Profit | Profit = (P – VC) × Q – FC | (100 – 50) × 5,000 – 200,000 = Rs. 50,000 |
| MoS (Units) | MoS = Actual Sales – BEP | 6,000 – 4,000 = 2,000 units |
| CM Ratio | CMR = (CM / P) × 100% | (50/100) × 100% = 50% |
Exam Tip: Quick Revision Checklist
Before the exam, ask yourself:
- Can I define CM, BEP, and MoS?
- Can I calculate BEP in both units and rupees?
- Do I know how to plot a CVP graph?
- Can I identify fixed vs. variable costs in a scenario?
- Do I remember the assumptions of CVP analysis?
- Can I solve for target profit or required sales volume?
Pro Tip: Use real-world examples in your answers (e.g., Daraz, Ncell, Kathmandu shops) to make your explanations memorable and high-scoring!
Based on the TU BBS syllabus for Cost and Management Accounting (MGT212), unit 3.
Discussion
Loading…