Economics for BusinessUnit 214 min read
Demand Analysis, Elasticity & Market Applications
Unit 2 of Economics for Business explains how consumer demand is measured (demand function, determinants), how elasticity quantifies responsiveness to price/income, and how these principles apply to real markets like eSewa transactions, Daraz pricing, and Ncell tariffs.
Key Concepts and Definitions
Demand Function and Law of Demand
Demand refers to the quantity of a good or service that consumers are willing and able to purchase at various prices during a specific period, ceteris paribus (all else being equal).
The Law of Demand states that, all else being equal, when the price of a good falls, the quantity demanded rises, and vice versa. This inverse relationship arises due to:
- Substitution effect: Consumers switch to cheaper alternatives.
- Income effect: Lower prices increase purchasing power.
Demand Schedule is a table listing prices and corresponding quantities demanded. The Demand Curve is a graphical representation of this relationship, typically downward-sloping.
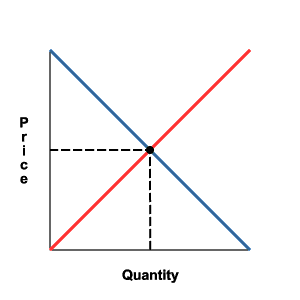 A downward-sloping demand curve intersecting an upward-sloping supply curve at equilibrium point E (P=Rs. 50, Q=100 units). (Image: en:User:Feco, CC BY-SA 3.0, via Wikimedia Commons)
Determinants of Demand
Five key factors shift the entire demand curve (not to be confused with movements along the curve due to price changes):
| Determinant | Effect on Demand | Example in Nepal |
|---|---|---|
| Consumer Income | Normal goods: ↑Income → ↑Demand; Inferior goods: ↑Income → ↓Demand | ↑Income → ↑Demand for organic vegetables (normal good) in Kathmandu. |
| Prices of Related Goods | Substitutes: ↑Price of substitute → ↑Demand; Complements: ↑Price of complement → ↓Demand | ↑Price of tea → ↑Demand for coffee (substitute). ↑Price of cars → ↓Demand for petrol (complement). |
| Consumer Preferences/Tastes | Favorable trends → ↑Demand | ↑Popularity of smartphones → ↑Demand for 4G services (Ncell). |
| Expectations | Expectation of future price hikes → ↑Current demand | Rumors of petrol price hike → ↑Demand for fuel in Nepal. |
| Number of Buyers | ↑Population/buyers → ↑Demand | ↑Tourism → ↑Demand for hotels in Pokhara. |
Elasticity of Demand
Elasticity measures how responsive quantity demanded is to changes in price, income, or other factors. It is calculated as the percentage change in quantity demanded divided by the percentage change in the variable (price/income).
Price Elasticity of Demand (PED)
Classification of PED:
| PED Value | Type of Demand | Graph Shape | Example in Nepal |
|---|---|---|---|
| PED > 1 | Elastic | Flatter curve | Demand for luxury cars (e.g., Toyota Fortuner) is elastic; price ↑ → Qd ↓ significantly. |
| PED = 1 | Unit Elastic | 45° angle | Demand for generic medicines; price and Qd change proportionally. |
| PED < 1 | Inelastic | Steeper curve | Demand for salt or insulin is inelastic; price changes have little effect on Qd. |
| PED = 0 | Perfectly Inelastic | Vertical line | Demand for life-saving drugs (e.g., cancer medication). |
| PED = ∞ | Perfectly Elastic | Horizontal line | Demand for identical products (e.g., generic brands of rice in local markets). |
Factors Affecting PED
- Availability of Substitutes: More substitutes → Higher elasticity (e.g., brands of mobile phones).
- Necessity vs. Luxury: Necessities (e.g., bread) are inelastic; luxuries (e.g., vacations) are elastic.
- Proportion of Income Spent: Goods consuming a larger % of income (e.g., housing) tend to be more elastic.
- Time Period: Demand is more elastic in the long run (e.g., fuel prices; consumers can switch to electric vehicles over time).
- Durability: Durable goods (e.g., refrigerators) have more elastic demand than nondurable goods (e.g., milk).
Income Elasticity of Demand (YED)
Measures responsiveness of demand to changes in consumer income:
Classification:
| YED Value | Type of Good | Example in Nepal |
|---|---|---|
| YED > 1 | Luxury/Superior Good | Demand for iPhones ↑ significantly when income ↑. |
| 0 < YED < 1 | Normal Good | Demand for rice ↑ moderately with income. |
| YED < 0 | Inferior Good | Demand for public transport ↓ as income ↑ (consumers switch to private vehicles). |
| YED = 0 | Necessity Good | Demand for basic salt remains constant regardless of income. |
Cross Elasticity of Demand (XED)
Measures responsiveness of demand for Good A to changes in the price of Good B:
Classification:
| XED Value | Relationship | Example in Nepal |
|---|---|---|
| XED > 0 | Substitutes | ↑Price of tea → ↑Demand for coffee (XED > 0). |
| XED < 0 | Complements | ↑Price of cars → ↓Demand for petrol (XED < 0). |
| XED = 0 | Unrelated Goods | Price of mobile phones has no effect on demand for toothpaste. |
Worked Example: Demand for Smartphones in Nepal
Assume the demand for smartphones in Nepal is given by: where:
- = Quantity demanded (units),
- = Price of smartphones (Rs.),
- = Average income (Rs.),
- = Price of complementary good (mobile data plans, Rs.).
Given:
- Initial price () = Rs. 20,000; Initial quantity () = 300 units.
- Initial income () = Rs. 50,000; Initial price of data plans () = Rs. 1,000.
- Price of smartphones rises to Rs. 25,000 ().
Step 1: Calculate initial demand
Step 2: Calculate new quantity demanded () after price change
Step 3: Calculate Price Elasticity of Demand (PED)
Interpretation: The demand for smartphones in Nepal is elastic (PED = -2.67). A 25% price increase leads to a 66.67% decrease in quantity demanded. This suggests that smartphone manufacturers like Ncell or Nepal Telecom should be cautious about raising prices, as it could significantly reduce sales.
In the Real World
eSewa and Khalti (Digital Payments)
- Elasticity in Action: The demand for digital payment services (eSewa, Khalti) is highly income elastic (YED > 1). As more Nepalis gain access to smartphones and banking, the demand for these services has surged. For example, Khalti’s user base grew from 500,000 in 2018 to over 10 million in 2023, driven by rising incomes and government push for digital transactions.
- Price Elasticity: The transaction fees (e.g., 2.5% for eSewa) are inelastic because users have few alternatives for secure online payments.
Daraz and Online Shopping
- Substitute Effect: Daraz’s demand for electronics is elastic because consumers can easily switch to competitors like Symbiosis or physical stores if prices rise. For instance, a 10% price increase on a popular laptop model might lead to a 20% drop in sales (PED = -2).
- Income Effect: Demand for premium products (e.g., Apple iPhones) on Daraz is luxury-driven (YED > 1). During festivals like Dashain, sales spike as disposable income rises.
Ncell and Telecom Tariffs
- Complementary Goods: The demand for mobile data plans (Ncell, NTC) is complementary to smartphone demand. If Ncell raises data prices by 30%, the demand for smartphones may drop slightly (negative XED) as consumers hesitate to buy new devices.
- Inelastic Necessity: Basic call plans are inelastic (PED < 1). Even if Ncell increases call rates by 20%, the quantity demanded may only drop by 5%, as calls are a necessity.
Nepal Rastra Bank (NRB) and Inflation
- Aggregate Demand: The NRB uses income elasticity to predict how changes in interest rates affect borrowing and spending. For example, if NRB cuts interest rates to stimulate the economy, demand for loans (e.g., home loans) rises due to lower cost of borrowing, increasing aggregate demand.
NEPSE and Stock Market
- Speculative Demand: The demand for stocks like NMB Bank or Global IME is highly elastic in the short run. News of profit growth can cause a sudden spike in demand, while bad news leads to sharp sell-offs. For example, during the COVID-19 pandemic, demand for healthcare stocks became extremely elastic due to uncertainty.
Applications of Demand Analysis
1. Pricing Strategies
- Elastic Goods: Companies like Daraz or Pathao offer discounts during sales to boost demand for elastic products (e.g., electronics, ride-hailing services).
- Inelastic Goods: NTC charges higher prices for essential services like landline connections because demand is inelastic.
2. Government Policies
- Subsidy on Essential Goods: The Nepal government subsidizes kerosene and LPG because demand is inelastic. Price hikes would disproportionately hurt low-income households.
- Taxation on Luxury Items: VAT on luxury cars (e.g., SUVs) is higher because demand is elastic. Taxes reduce consumption without causing major backlash.
3. Business Forecasting
- Seasonal Demand: Hotel bookings in Pokhara spike during peak seasons (Oct–Nov, March–April). Hotels use demand forecasting to adjust prices dynamically.
- Income Growth Projections: Banks use YED to predict loan demand. For example, if GDP growth is 5%, demand for home loans may rise by 3–4% (assuming YED ≈ 0.8 for housing).
Comparison Table: Demand vs. Supply
| Feature | Demand | Supply |
|---|---|---|
| Direction of Curve | Downward-sloping (↓P → ↑Qd) | Upward-sloping (↑P → ↑Qs) |
| Determinants | Income, prices of related goods, tastes, expectations, number of buyers | Cost of production, technology, taxes, prices of related goods, expectations |
| Elasticity Focus | Price elasticity (PED), income elasticity (YED), cross elasticity (XED) | Price elasticity of supply (PES), responsiveness to cost changes |
| Shift Causes | Changes in non-price factors (e.g., ↑income shifts D right) | Changes in non-price factors (e.g., ↑technology shifts S right) |
| Movement Along Curve | Caused by price changes (e.g., ↓P → move down along D) | Caused by price changes (e.g., ↑P → move up along S) |
Exam Tip
Diagrams Are Key: Always draw demand curves with shifts (dashed lines) and label equilibrium points clearly. Examiners love well-labeled diagrams.
- Example: If asked about the effect of ↑income on demand for organic food, shift D right and show new equilibrium with higher P and Q.
Numerical Problems: Practice calculating PED, YED, and XED using real data. Memorize the formula:
- Use midpoint formula for accuracy:
Real-World Links: Relate theory to Nepali examples (e.g., Ncell tariffs, Daraz discounts, NRB policies). Examiners appreciate context.
Common Mistakes to Avoid:
- Confusing movements along the curve (price change) with shifts in the curve (non-price factors).
- Forgetting ceteris paribus (assume all else is constant unless stated).
- Misclassifying goods (e.g., calling a necessity like salt "elastic").
Short-Answer Tips:
- For definitions, use bullet points (e.g., "Demand determinants: income, tastes, substitutes...").
- For elasticity, state the value and classify (e.g., "PED = 0.5 → Inelastic demand").
Based on the TU BIM syllabus for Economics for Business (ECO206), unit 2.
Discussion
Loading…