Operating SystemUnit 98 min read
I/O Systems, Disk Scheduling & Storage Management
Unit 9 of Operating System: Covers I/O subsystems (hardware/software layers), buffering/caching, disk scheduling algorithms (FCFS, SSTF, SCAN, C-SCAN, LOOK), RAID levels, and storage management (partitioning, formatting, booting). Includes real-world examples from eSewa, NTC, and Daraz.
I/O Subsystem: Hardware and Software Layers
1. I/O Hardware Components
The I/O subsystem connects the CPU to peripheral devices (e.g., keyboards, disks, printers). Key components include:
- I/O Devices: Input (keyboard, scanner) and output (printer, monitor) devices.
- Controllers: Hardware interfaces (e.g., SATA, USB) that translate CPU commands into device-specific signals.
- Device Drivers: Software that controls hardware (e.g.,
nvmefor SSDs,atafor HDDs).
classDiagram
    class CPU {
        +Issue I/O requests
    }
    class DeviceDriver {
        +Translate CPU commands
    }
    class Controller {
        +Communicate with hardware
    }
    class IODEvice {
        +Perform actual I/O
    }
    CPU --> DeviceDriver : "Sends request"
    DeviceDriver --> Controller : "Sends command"
    Controller --> IODEvice : "Executes I/O"
2. I/O Software Layers
The OS manages I/O through layered software:
- User-Level I/O: Libraries (e.g.,
stdio.hin C) for high-level operations (e.g.,fopen()). - Kernel I/O Subsystem: Handles device drivers, buffering, and scheduling.
- Hardware Abstraction Layer (HAL): Standardizes hardware access (e.g.,
ioctlin Linux).
Example: When you upload a file to eSewa, the OS uses:
- User-level:
fopen()to open the file. - Kernel: Buffers data in memory before sending it to the network controller.
- Hardware: The NIC (Network Interface Card) transmits data to eSewa’s servers.
Buffering and Caching in I/O
1. Buffering
Temporarily stores data in memory to reduce slow device access (e.g., disk I/O). Types:
- Single Buffering: Data is read into a buffer, processed, then written out.
- Double Buffering: Two buffers alternate (used in video streaming).
- Circular Buffering: Used in real-time systems (e.g., audio streaming).
Example: WhatsApp uses buffering to:
- Store incoming messages in memory before displaying them.
- Reduce lag by preloading media files.
2. Caching
Stores frequently accessed data in faster memory (e.g., RAM cache for disk blocks). Improves performance by reducing disk reads.
Comparison Table:
| Feature | Buffering | Caching |
|---|---|---|
| Purpose | Temporarily hold data during transfer | Store frequently used data |
| Location | Memory or device-specific buffers | RAM or SSD cache |
| Example | Printing a large file | Browser caching web pages |
Disk Scheduling Algorithms
The OS schedules disk requests to minimize seek time (time to move the disk head) and rotational latency.
1. Seek Time vs. Rotational Latency
- Seek Time: Time to move the disk head to the correct track (e.g., 5–10 ms).
- Rotational Latency: Time to wait for the desired sector to rotate under the head (e.g., 2–5 ms).
Example: NTC’s billing system processes customer payments in batches. If requests arrive in order 100, 200, 300 (tracks), but the head is at 200, the OS can optimize by scheduling 200 → 100 → 300 (reducing seek time).
2. Algorithms
a. First-Come, First-Served (FCFS)
- Requests are served in arrival order.
- Disadvantage: High average wait time (e.g.,
100 → 500 → 200has long seeks).
b. Shortest Seek Time First (SSTF)
- Serves the closest request first.
- Disadvantage: Starvation (far requests may never be served).
c. SCAN (Elevator Algorithm)
- Moves the head in one direction, serving requests, then reverses.
- Example: Like a bus stopping at all stations on a route before turning back.
d. C-SCAN (Circular SCAN)
- Moves head in one direction, serves requests, then jumps to the start.
- Advantance: Fairer than SCAN (no long waits at the end).
e. LOOK
- Like SCAN but stops at the last request in the current direction.
Mermaid Diagram: Disk Head Movement
sequenceDiagram
    participant Head as Disk Head
    participant Requests as Request Queue
    Requests->>Head: 100 (arrives)
    Requests->>Head: 200 (arrives)
    Requests->>Head: 300 (arrives)
    Head->>Requests: SCAN (100 → 200 → 300 → 150)
    Note right of Head: Head moves right, then reverses
Worked Example: Suppose requests arrive at tracks 98, 183, 37, 122, 14, 124, 65, 67 and the head starts at 53.
- FCFS: Total seek time =
45 + 130 + 146 + 11 + 108 + 2 + 59 + 2= 503. - SCAN: Head moves right to
183(serves98, 122, 124, 14), then left to37(serves67, 65, 14). Total seek time = 236 (better!).
RAID (Redundant Array of Independent Disks)
RAID improves performance, reliability, or both by combining multiple disks.
1. RAID Levels
| Level | Description | Use Case | Example |
|---|---|---|---|
| 0 | Striping (no redundancy) | High performance | Video editing workstations |
| 1 | Mirroring (duplicate data) | Fault tolerance | Critical databases |
| 5 | Striping + parity (fault tolerance) | Balance of speed and safety | Home NAS (Network Attached Storage) |
| 6 | Striping + dual parity | High reliability | Enterprise storage |
Example: Daraz’s order processing system uses RAID 10 (combination of RAID 1 + 0) to:
- Mirror data for redundancy.
- Strip across disks for fast order fulfillment.
Disk Management: Partitioning, Formatting, and Booting
1. Partitioning
Divides a disk into logical sections (e.g., C:, D: in Windows).
- Primary Partition: Bootable (e.g.,
/bootin Linux). - Extended Partition: Can contain logical drives.
Example: A laptop with:
- Partition 1:
/boot(500 MB, for OS files). - Partition 2:
/home(200 GB, for user files).
2. Formatting
Creates a filesystem (e.g., FAT32, NTFS, ext4) to organize data.
- Low-level formatting: Divides disk into sectors.
- High-level formatting: Creates filesystem structures (e.g., inodes in ext4).
3. Booting Process
- BIOS/UEFI: Checks hardware and loads the bootloader.
- Bootloader (e.g., GRUB): Loads the OS kernel.
- Kernel: Initializes drivers and starts the OS.
Mermaid Diagram: Boot Process
stateDiagram-v2
[*] --> BIOS
BIOS --> Bootloader
Bootloader --> Kernel
Kernel --> OS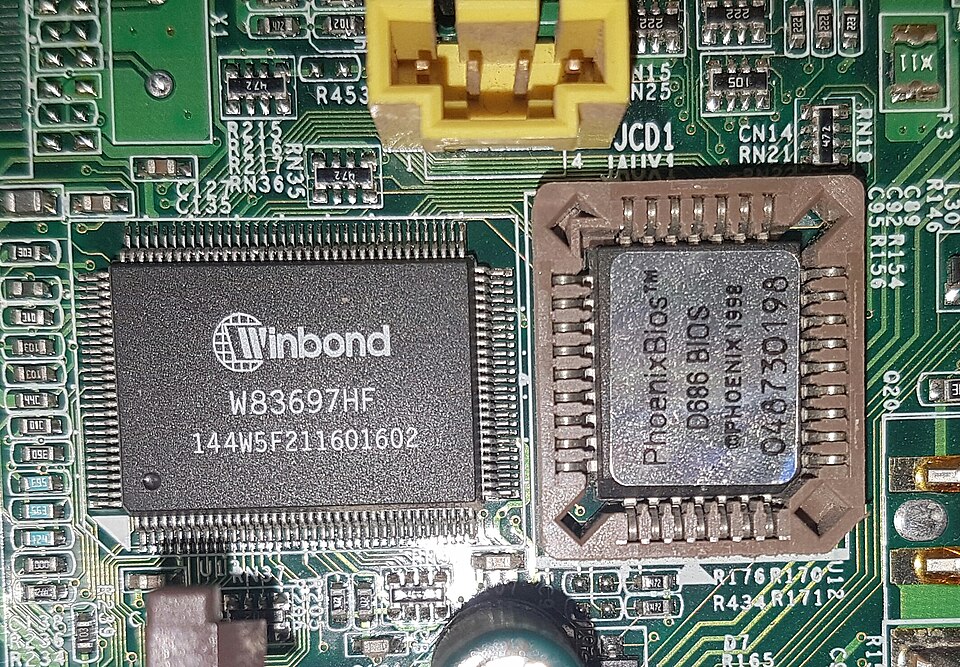 A labelled picture of a BIOS/UEFI chip on a motherboard. (Image: TheStriker, CC BY-SA 4.0, via Wikimedia Commons)
I/O System Performance Metrics
| Metric | Definition | Example |
|---|---|---|
| Throughput | Data transferred per unit time | 100 MB/s for a SSD |
| Latency | Time from request to first byte | 10 ms for a HDD read |
| Bandwidth | Max data rate | 3.5 Gbps for NVMe SSDs |
| I/O Bound | Process spends more time waiting for I/O | Database queries |
Example: NEPSE’s trading system is I/O-bound because:
- It reads/writes stock prices from disks frequently.
- Uses SSD RAID arrays to reduce latency.
In the Real World
eSewa’s Payment Processing
- Uses buffering to queue transactions before processing.
- Employs disk scheduling (SCAN) to minimize seek time when reading user data.
NTC’s Billing System
- Relies on RAID 10 for redundancy (no downtime during peak hours).
- Uses caching to store frequent customer queries in RAM.
Pathao’s Ride Matching
- I/O-bound: Matches riders/drivers by reading/writing to a database.
- Optimizes with SSD storage to reduce latency in high-demand areas (e.g., Thapathali).
Exam Tip
- Disk Scheduling: Always calculate total seek time for FCFS vs. SCAN/SSTF. Assume the head starts at a given track (e.g.,
53). - RAID: Know the trade-offs (e.g., RAID 0 = speed, RAID 1 = safety, RAID 5 = balance).
- Boot Process: Draw the sequence (BIOS → Bootloader → Kernel).
- Buffering vs. Caching: Buffering is for transfer; caching is for reuse.
- Real-World Links: Relate algorithms to companies (e.g., "NTC uses SCAN for billing").
Key Formula: Total Seek Time = Σ |Current Track – Next Track| (for all requests).
Based on the TU BIM syllabus for Operating System (IT241), unit 9.
Discussion
Loading…