Software Design and DevelopmentUnit 411 min read
UML Diagrams, Use Cases & Class Models
Unit 4 of Software Design and Development covers Unified Modeling Language (UML)—its 14 diagrams, use-case modeling, class diagrams, object diagrams, sequence diagrams, state machines, and activity diagrams—with real-world examples from Nepali apps (eSewa, Daraz) and global tech (Google Maps, WhatsApp). Learn how to mo
TAKEAWAYS:
- UML is a standardized visual language for modeling software systems, with 14 diagrams grouped into structural (class, object, component) and behavioral (use case, sequence, state) types.
- Use-case diagrams capture actors (users/systems) and their interactions with the system, while class diagrams model classes, attributes, methods, and relationships (inheritance, association, aggregation).
- Sequence diagrams show message flows between objects over time (e.g., a Daraz order processing workflow), while state diagrams model object lifecycles (e.g., a WhatsApp message: sent → delivered → read).
- Activity diagrams model workflows (e.g., eSewa payment: login → select service → pay → confirm), and component diagrams show software architecture (e.g., Daraz’s frontend-backend-service layers).
- Exam traps: Confusing association vs. aggregation, omitting multiplicity in class diagrams, or drawing sequence diagrams without lifelines. Always label arrows and show return messages.
- Real-world tie: Google Maps uses state diagrams for route calculations (planning → navigating → rerouting) and sequence diagrams for API calls between user, server, and traffic data providers.
1. Introduction to UML: Purpose and Diagrams
UML (Unified Modeling Language) is a standardized visual notation for modeling software systems. It helps developers:
- Communicate designs clearly.
- Document system behavior and structure.
- Trace requirements to implementation.
UML has 14 diagrams, divided into:
| Category | Diagrams | Purpose |
|---|---|---|
| Structural | Class, Object, Component, Deployment, Package, Profile | Show static structure (classes, relationships, architecture). |
| Behavioral | Use Case, Sequence, Communication, State, Activity, Interaction Overview | Show dynamic behavior (flows, states, processes). |
Why UML?
- Standardized: Used globally (e.g., IBM, Google, Nepali banks like NMB).
- Flexible: Can model business processes (e.g., Daraz order workflow) or software systems (e.g., eSewa payment gateway).
- Exam focus: TU/PU exams test use-case, class, and sequence diagrams most frequently.
2. Use-Case Diagrams: Modeling Actors and Interactions
A use-case diagram shows:
- Actors (external entities: users, systems, or hardware).
- Use cases (system functionalities).
- Relationships (
<<includes>>,<<extends>>).
Key Elements
classDiagram
    class Actor {
        +name: String
        +type: "Primary/Secondary"
        +description: String
    }
    class UseCase {
        +name: String
        +description: String
    }
    Actor "1" --* "uses" UseCase : "uses"
    UseCase "1" --> "1" UseCase : "<<includes>>"
    UseCase "1" -->|> "1" UseCase : "<<extends>>"
    note for Actor "Primary actors (e.g., Customer)"
    note for UseCase "Secondary actors (e.g., Payment Gateway)"
UML Use-Case Diagram with actor types and relationships (includes/extends)Worked Example: eSewa Payment System
Actors:
- Primary: User, Merchant.
- Secondary: Bank, NTC (for bill payments).
Use Cases:
- Login (User → eSewa).
- Pay Bill (User → NTC via eSewa).
- Transfer Money (User → Bank via eSewa).
- Generate QR (Merchant → eSewa).
Relationships:
Pay BillincludesLogin.Transfer MoneyextendsPay Bill(optional feature).
Common Mistakes
- Forgetting to label
<<includes>>/<<extends>>(exam deductions!). - Drawing actors as stereotyped humans (use stick figures).
- Missing multiplicity (e.g., 1 User → * Payments).
3. Class Diagrams: Modeling Structure
A class diagram shows:
- Classes (with attributes and methods).
- Relationships (association, aggregation, inheritance, composition).
Key Symbols
| Symbol | Meaning | Example |
|---|---|---|
| Solid Line | Association | Customer — Order |
| Hollow Diamond | Aggregation ("has-a", weak) | Department ◊ Employee |
| Filled Diamond | Composition ("owns", strong) | Car ◆ Engine |
| Triangle | Inheritance ("is-a") | Animal → Dog |
| Dashed Line | Dependency (temporary use) | Printer ..> PrintJob |
Worked Example: Daraz Order System
classDiagram
    class Customer {
        -customerID: String
        -name: String
        +placeOrder()
    }
    class Order {
        -orderID: String
        -date: Date
        -status: String
        +calculateTotal()
    }
    class Product {
        -productID: String
        -price: Double
        -stock: Int
    }
    class Cart {
        -items: List~Product~
        +addItem()
    }
    Customer "1" --> "*" Order : "places"
    Order "1" --> "*" Product : "contains"
    Customer "1" --> "1" Cart : "has"
    Cart --> "*" Product : "holds"
Key Notes:
- Multiplicity: 1 Customer → * Orders (one customer can place many orders).
- Aggregation:
CartholdsProduct(if cart is deleted, products still exist). - Exam tip: Always show visibility (
+,-,#) and data types.
4. Sequence Diagrams: Modeling Dynamic Interactions
A sequence diagram shows:
- Objects (lifelines).
- Messages (synchronous/asynchronous calls).
- Activation bars (method execution time).
Worked Example: Pathao Ride Booking
sequenceDiagram
    participant User
    participant PathaoApp
    participant Driver
    participant PaymentGateway

    User->>PathaoApp: Request Ride("KTM to Lakshmi")
    PathaoApp->>Driver: Assign Ride()
    Driver-->>PathaoApp: Accept()
    PathaoApp->>User: Show Driver Location()
    User->>PaymentGateway: Pay(NPR 500)
    PaymentGateway-->>PathaoApp: Confirm Payment()
    PathaoApp->>Driver: Release Ride()
Key Notes:
- Arrows: Solid = synchronous, dashed = asynchronous.
- Return messages: Always show responses (e.g.,
Confirm Payment). - Exam trap: Missing activation bars or object creation (
:Driver).
5. State Diagrams: Modeling Object Lifecycles
A state diagram shows:
- States (e.g., Order Placed, Shipped).
- Transitions (events triggering changes).
- Initial/final states.
Worked Example: WhatsApp Message
stateDiagram-v2
    [*] --> Sent
    Sent --> Delivered : "Message sent"
    Delivered --> Read : "Recipient opens"
    Delivered --> Archived : "Timeout (24h)"
    Read --> Archived : "Message read"
    Archived --> [*]
Real-World Tie:
- Ncell’s "Order Status": Uses state diagrams for Placed → Processing → Shipped → Delivered.
- Exam tip: Always show guards (conditions) like
[timeout]or events likeonClick.
6. Activity Diagrams: Modeling Workflows
An activity diagram is a flowchart for processes, showing:
- Actions (activities).
- Fork/join (parallel paths).
- Decision nodes (diamonds).
Worked Example: eSewa Payment Flow
flowchart TD
    A["Start"] --> B["User Logs In"]
    B --> C{"Authenticated?"}
    C -->|"Yes"| D["Select Service"]
    C -->|"No"| E["Show Error"]
    D --> F["Enter Amount"]
    F --> G["Generate QR"]
    G --> H["Scan QR"]
    H --> I["Confirm Payment"]
    I --> J["Show Receipt"]
      QR Code Example:
      {"type":"barcode","data":"eSewa1234567890","format":"QR"}
eSewa payment flow with decision nodes and QR generation stepKey Notes:
- Swimlanes: Separate actors (e.g., User | Bank | eSewa).
- Exam trap: Forgetting initial/final nodes or merge nodes.
7. Other UML Diagrams (Brief Overview)
| Diagram | When to Use | Example |
|---|---|---|
| Component | Show software modules (e.g., Daraz API). | Frontend <<uses>> Backend |
| Deployment | Show hardware (servers, routers). | Nepal Server <<hosts>> Ncell DB |
| Communication | Similar to sequence but focuses on objects. | User --> Cart : addItem() |
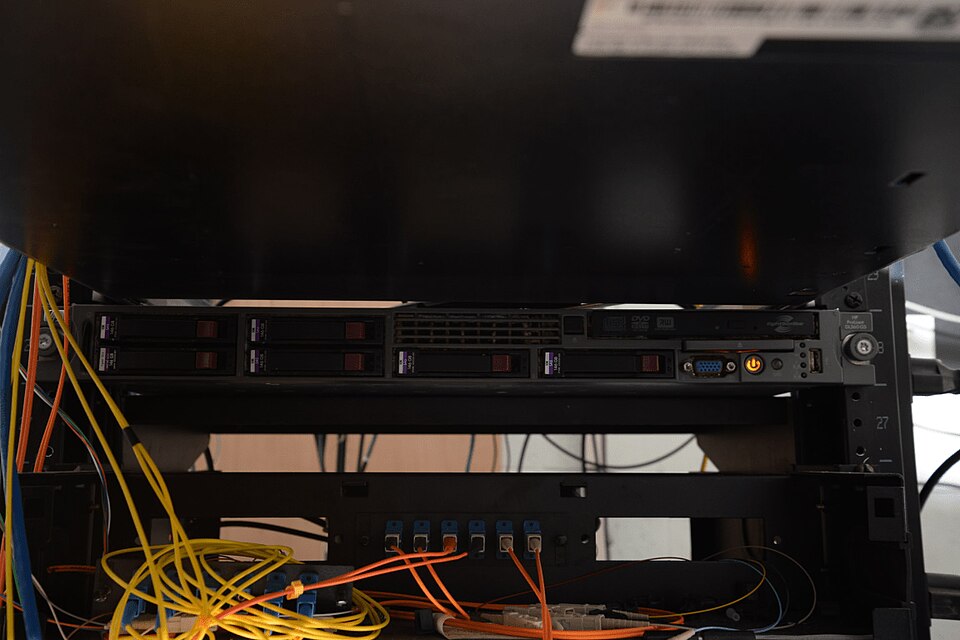 Deployment diagram example (Ncell’s backend servers) (Image: Federal Bureau of Investigation, Public domain, via Wikimedia Commons)
In the Real World
eSewa (Nepal)
- Uses use-case diagrams to model User → Payment → Bank flows.
- Sequence diagrams track API calls between eSewa, banks (NMB, SBI), and NTC.
- State diagrams manage transaction states: Pending → Processing → Completed.
Daraz (Nepal)
- Class diagrams model
Customer,Order,Productrelationships. - Activity diagrams optimize warehouse workflows (e.g., Pick → Pack → Ship).
- Sequence diagrams debug order failures (e.g., stock unavailability).
- Class diagrams model
Google Maps (Global)
- State diagrams handle route recalculations (Driving → Traffic → Reroute).
- Sequence diagrams show API calls: User → Google Maps → Traffic Server → User.
- Exam tie: If asked about "real-time systems," Google Maps is a classic example.
Exam Tip
- Diagram Selection:
- Behavior: Use use-case (requirements) or sequence (dynamic flow).
- Structure: Use class (design) or component (architecture).
Marks Distribution:
- Labels: 30% (e.g.,
<<includes>>,+method()). - Relationships: 40% (correct arrows, multiplicity).
- Clarity: 30% (no clutter, proper layout).
- Labels: 30% (e.g.,
Common Exam Questions:
- "Draw a use-case diagram for a bank ATM system." → Include
Customer,Admin,Withdraw,Check Balance. - "Model a Daraz order system using class diagrams." → Show
Customer,Order,Productwith relationships. - "Trace a WhatsApp message using a sequence diagram." → Include
User → Server → Recipient.
- "Draw a use-case diagram for a bank ATM system." → Include
Avoid:
- Overloading diagrams: One diagram = one clear idea.
- Incorrect multiplicity:
1..*(one or more) ≠0..1(optional). - Skipping notes: Always add a legend or description.
Final Note: UML is not just drawing—it’s thinking like a system designer. Practice by:
- Modeling apps you use daily (e.g., Khalti, Pathao).
- Tracing exam questions to real-world examples (e.g., bank loans → state diagrams).
- Using tools like Lucidchart or Draw.io for practice.
Based on the TU BIM syllabus for Software Design and Development (IT242), unit 4.
Discussion
Loading…