Data Warehousing and Data MiningUnit 98 min read
Cluster Analysis: Techniques, Algorithms & Applications
Unit 9 of Data Warehousing and Data Mining explores unsupervised learning’s cluster analysis—how to group unlabeled data, key algorithms (K-means, hierarchical, DBSCAN), distance metrics, validation methods, and real-world applications in customer segmentation, fraud detection, and image compression.
What is Cluster Analysis?
Cluster analysis is an unsupervised learning technique that groups similar data points into clusters based on their features, without predefined labels. Unlike classification (supervised), it discovers hidden patterns in data.
Key Characteristics:
- No labels: Input data has no target variable.
- Similarity-based: Groups objects with similar attributes.
- Exploratory: Used to uncover unknown structures in data.
Why Use Cluster Analysis?
Applications in Nepal:
- eSewa: Groups users by transaction behavior to personalize offers (e.g., frequent bill payers vs. one-time users).
- Pathao: Clusters drivers by route efficiency to optimize ride assignments.
- NTC: Analyzes call patterns to detect fraudulent SIMs (e.g., clusters of high-volume calls at odd hours).
Global Examples:
- Google: Clusters search queries to improve autocomplete suggestions.
- Netflix: Groups users by viewing habits to recommend shows.
- Banks: Identify high-risk loan applicants via spending clusters.
Distance Metrics: How Similarity is Measured
Clustering relies on distance metrics to quantify similarity. Common metrics:
| Metric | Formula (for 2 points ) | Use Case |
|---|---|---|
| Euclidean | General-purpose clustering | |
| Manhattan | Grid-based data (e.g., city blocks) | |
| Cosine | Text/data with high dimensions |
Example: For points and :
- Euclidean distance = .
- Manhattan distance = .
Clustering Algorithms
1. Partitioning Methods (K-means)
How it works:
- Randomly select centroids.
- Assign each point to the nearest centroid.
- Recalculate centroids as the mean of assigned points.
- Repeat until convergence.
Worked Example: Cluster these 5 points into groups using K-means:
Points: (2,3), (4,5), (6,7), (8,9), (1,1)
- Step 1: Choose centroids at and .
- Step 2: Assign points:
- Cluster 1:
- Cluster 2:
- Step 3: Recalculate centroids:
- New centroid 1:
- New centroid 2:
- Repeat: No further changes → Final clusters:
- Cluster 1:
- Cluster 2:
Real-World Tie-In: Daraz could use K-means to group customers by purchase frequency to target promotions. For example:
- Cluster 1: High-frequency buyers (e.g., weekly orders).
- Cluster 2: Low-frequency buyers (e.g., seasonal shoppers).
2. Hierarchical Clustering
How it works:
- Agglomerative: Starts with each point as a cluster, merges the closest pairs iteratively.
- Divisive: Starts with one cluster, splits recursively.
Example: Cluster these 4 points hierarchically:
Points: A(1,2), B(1,4), C(5,6), D(5,8)
- Step 1: Compute pairwise distances (Euclidean):
- , , , etc.
- Step 2: Merge closest pair: and → Cluster .
- Step 3: Recompute distances (e.g., ).
- Step 4: Merge and → Cluster , then merge with .
Visualization:
Dendrogram (tree of merges):
        ________D______
       /                   \
{A,B}                     C
 /   \                     /
A     B                   D
Use Case: NEPSE could use hierarchical clustering to group stocks by volatility for portfolio diversification.
3. Density-Based: DBSCAN
How it works:
- Groups points in dense regions, marks outliers as noise.
- Parameters:
- eps: Maximum distance between two points to be considered neighbors.
- minPts: Minimum points to form a dense region.
Example: For eps=3 and minPts=2:
Points: (1,2), (2,3), (3,1), (10,10), (11,11)
- Step 1: Start at :
- Neighbors: → Form cluster 1.
- Step 2: has no neighbors within
eps=3→ Noise. - Result:
- Cluster 1:
- Noise:
Real-World Tie-In: Ncell could use DBSCAN to detect fraudulent call clusters (e.g., spam calls in a dense region vs. isolated outliers).
Cluster Validation
Internal Metrics:
| Metric | Description | Ideal Value |
|---|---|---|
| Silhouette | Measures cohesion/separation (range: -1 to 1) | Closer to +1 |
| Davies-Bouldin | Ratio of within-cluster to between-cluster distances | Lower is better |
| Elbow Method | Plot distortion vs. (look for "elbow") | K at the bend |
Example: For to , the elbow occurs at :
Distortion: [50, 30, 15, 12, 10]
→ Choose .
Advanced Techniques
1. Fuzzy C-Means
- Allows points to belong to multiple clusters with membership probabilities.
- Useful when hard boundaries don’t exist (e.g., customer segments overlapping).
2. Spectral Clustering
- Uses graph Laplacian to improve partitioning for non-convex clusters.
3. Model-Based Clustering
- Assumes data is generated from a mixture of distributions (e.g., Gaussian Mixture Models).
Applications in Nepal
| Sector | Use Case | Algorithm |
|---|---|---|
| Banking | Customer segmentation for loan approvals | K-means |
| Healthcare | Disease outbreak detection (e.g., COVID clusters) | DBSCAN |
| Retail | Product recommendation groups | Hierarchical |
| Traffic | Congestion hotspot identification | Density-based |
Example: Khalti could cluster merchants by transaction volume to detect high-risk accounts:
- Cluster 1: Low-volume merchants (safe).
- Cluster 2: High-volume merchants (flag for review).
Challenges and Limitations
- Scalability: Hierarchical clustering is .
- Parameter Sensitivity: K-means needs ; DBSCAN needs
epsandminPts. - Interpretability: Dense clusters may not align with business logic.
Exam Tip
Algorithm Selection:
- K-means: Fast, scalable, but assumes spherical clusters.
- DBSCAN: Handles noise, but struggles with varying densities.
- Hierarchical: Interpretability (dendrograms), but slow for large data.
Worked Examples:
- Always show distance calculations (Euclidean/Manhattan).
- For K-means, demonstrate centroid updates step-by-step.
- For DBSCAN, highlight eps-neighborhoods and noise points.
Real-World Links:
- Tie clustering to customer segmentation, fraud detection, or traffic analysis.
- Example: "How would Pathao use K-means to optimize driver assignments?"
Validation:
- Know Silhouette Score and Elbow Method for choosing .
- Compare algorithms using time complexity (e.g., K-means is per iteration).
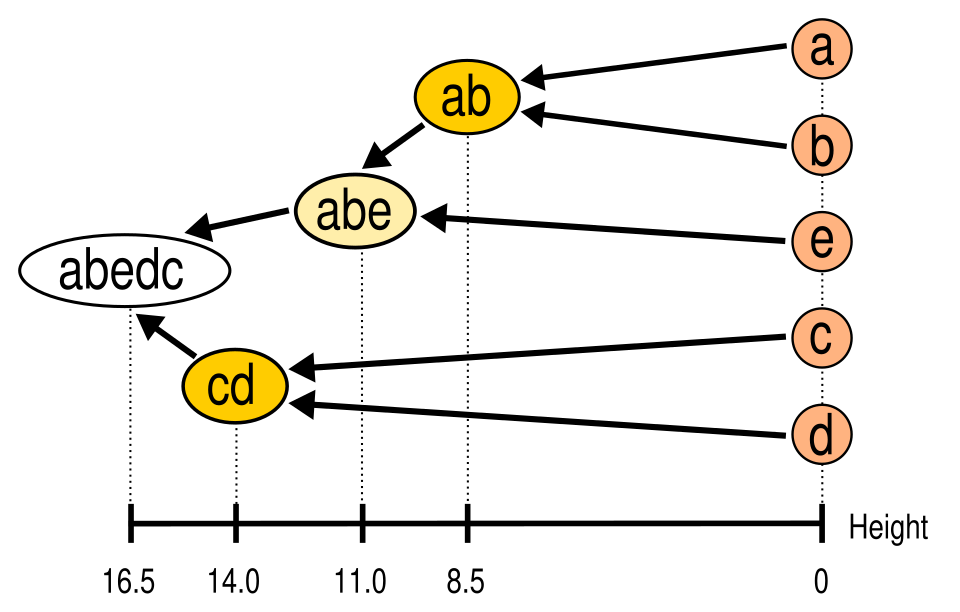 Hierarchical clustering dendrogram for 6 data points. (Image: This picture is a work by Emmanuel Douzery. Please credit th, CC BY-SA 4.0, via Wikimedia Commons)
Based on the TU BIM syllabus for Data Warehousing and Data Mining (IT274), unit 9.
Discussion
Loading…